Most executives want a presence on LinkedIn. Very few have time to write, schedule, and approve every post themselves.
That’s why more organizations are running executive influencer programs, where a trusted delegate (usually someone in marketing or comms) drafts and shares content on a leader’s behalf.
Once a program is up and running, what separates strong results from average ones?
We analyzed 1,118 executive LinkedIn posts and 2,540 share events from 62 organizations running executive influencer programs on the DSMN8 platform between January 1, 2025 and September 4, 2026 to find out.
Someone creates the post, then someone shares it to LinkedIn. Delegate access can cover either or both steps.
From our dataset:
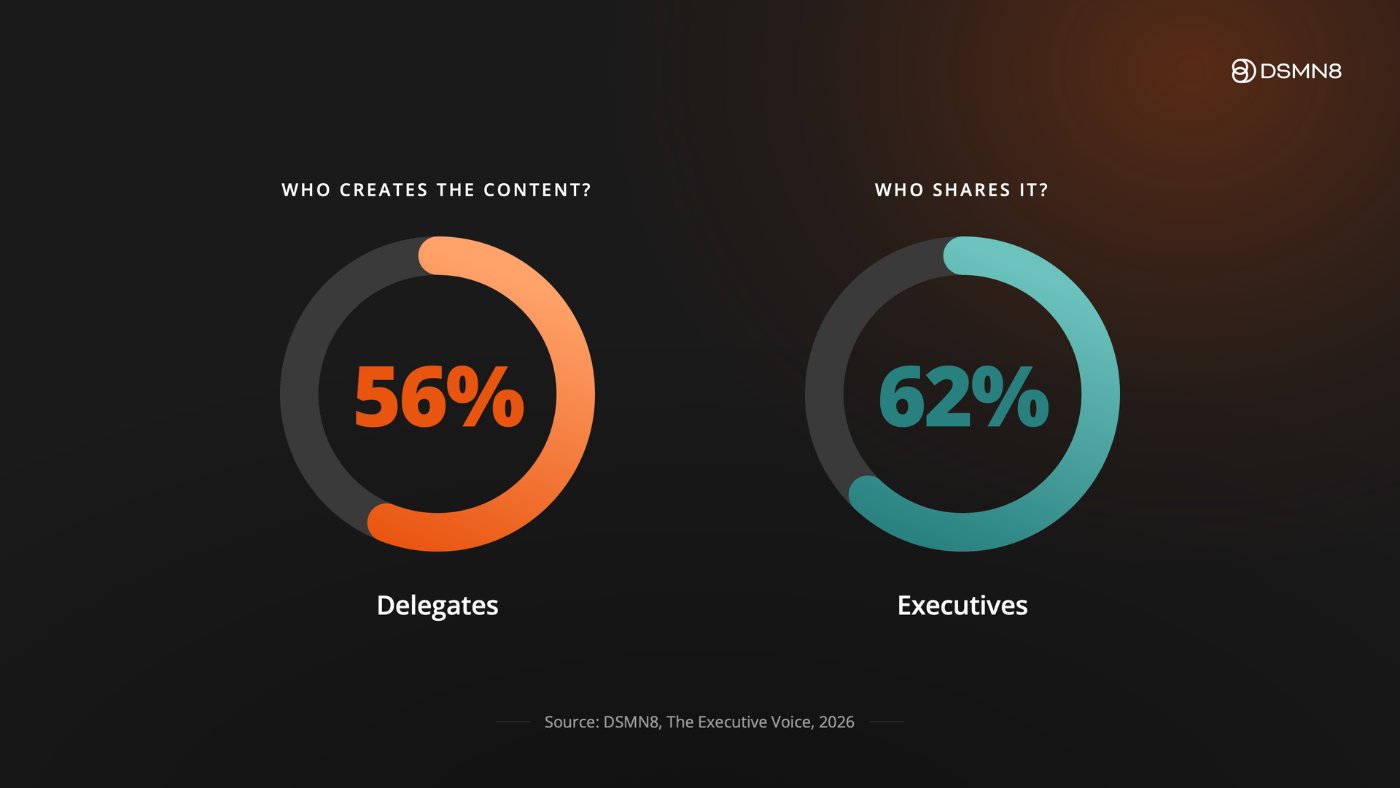
Delegates author 56% of executive posts (629 of 1,118).
Executives personally handle 62% of shares (1,584 of 2,540).
So the typical program sits somewhere in the middle. Delegates take on the heavier lift of sourcing and drafting content, while executives stay hands-on with what goes out under their name, and when.
That split makes sense. Very few senior leaders have time to build a content calendar, but most can review a draft and decide whether to post it. Delegate access fills that gap while keeping the executive in the loop!
Across the dataset, 143 active delegates support 160 executives. So for now, most delegates manage one leader at a time rather than a portfolio. We expect that to change over time as more senior leaders want to get involved after seeing their fellow C-Suite colleagues getting great results.
Executive Posts Reach Nearly 2x Further Than Employee Posts
Once an executive starts posting, the reach shows up quickly.
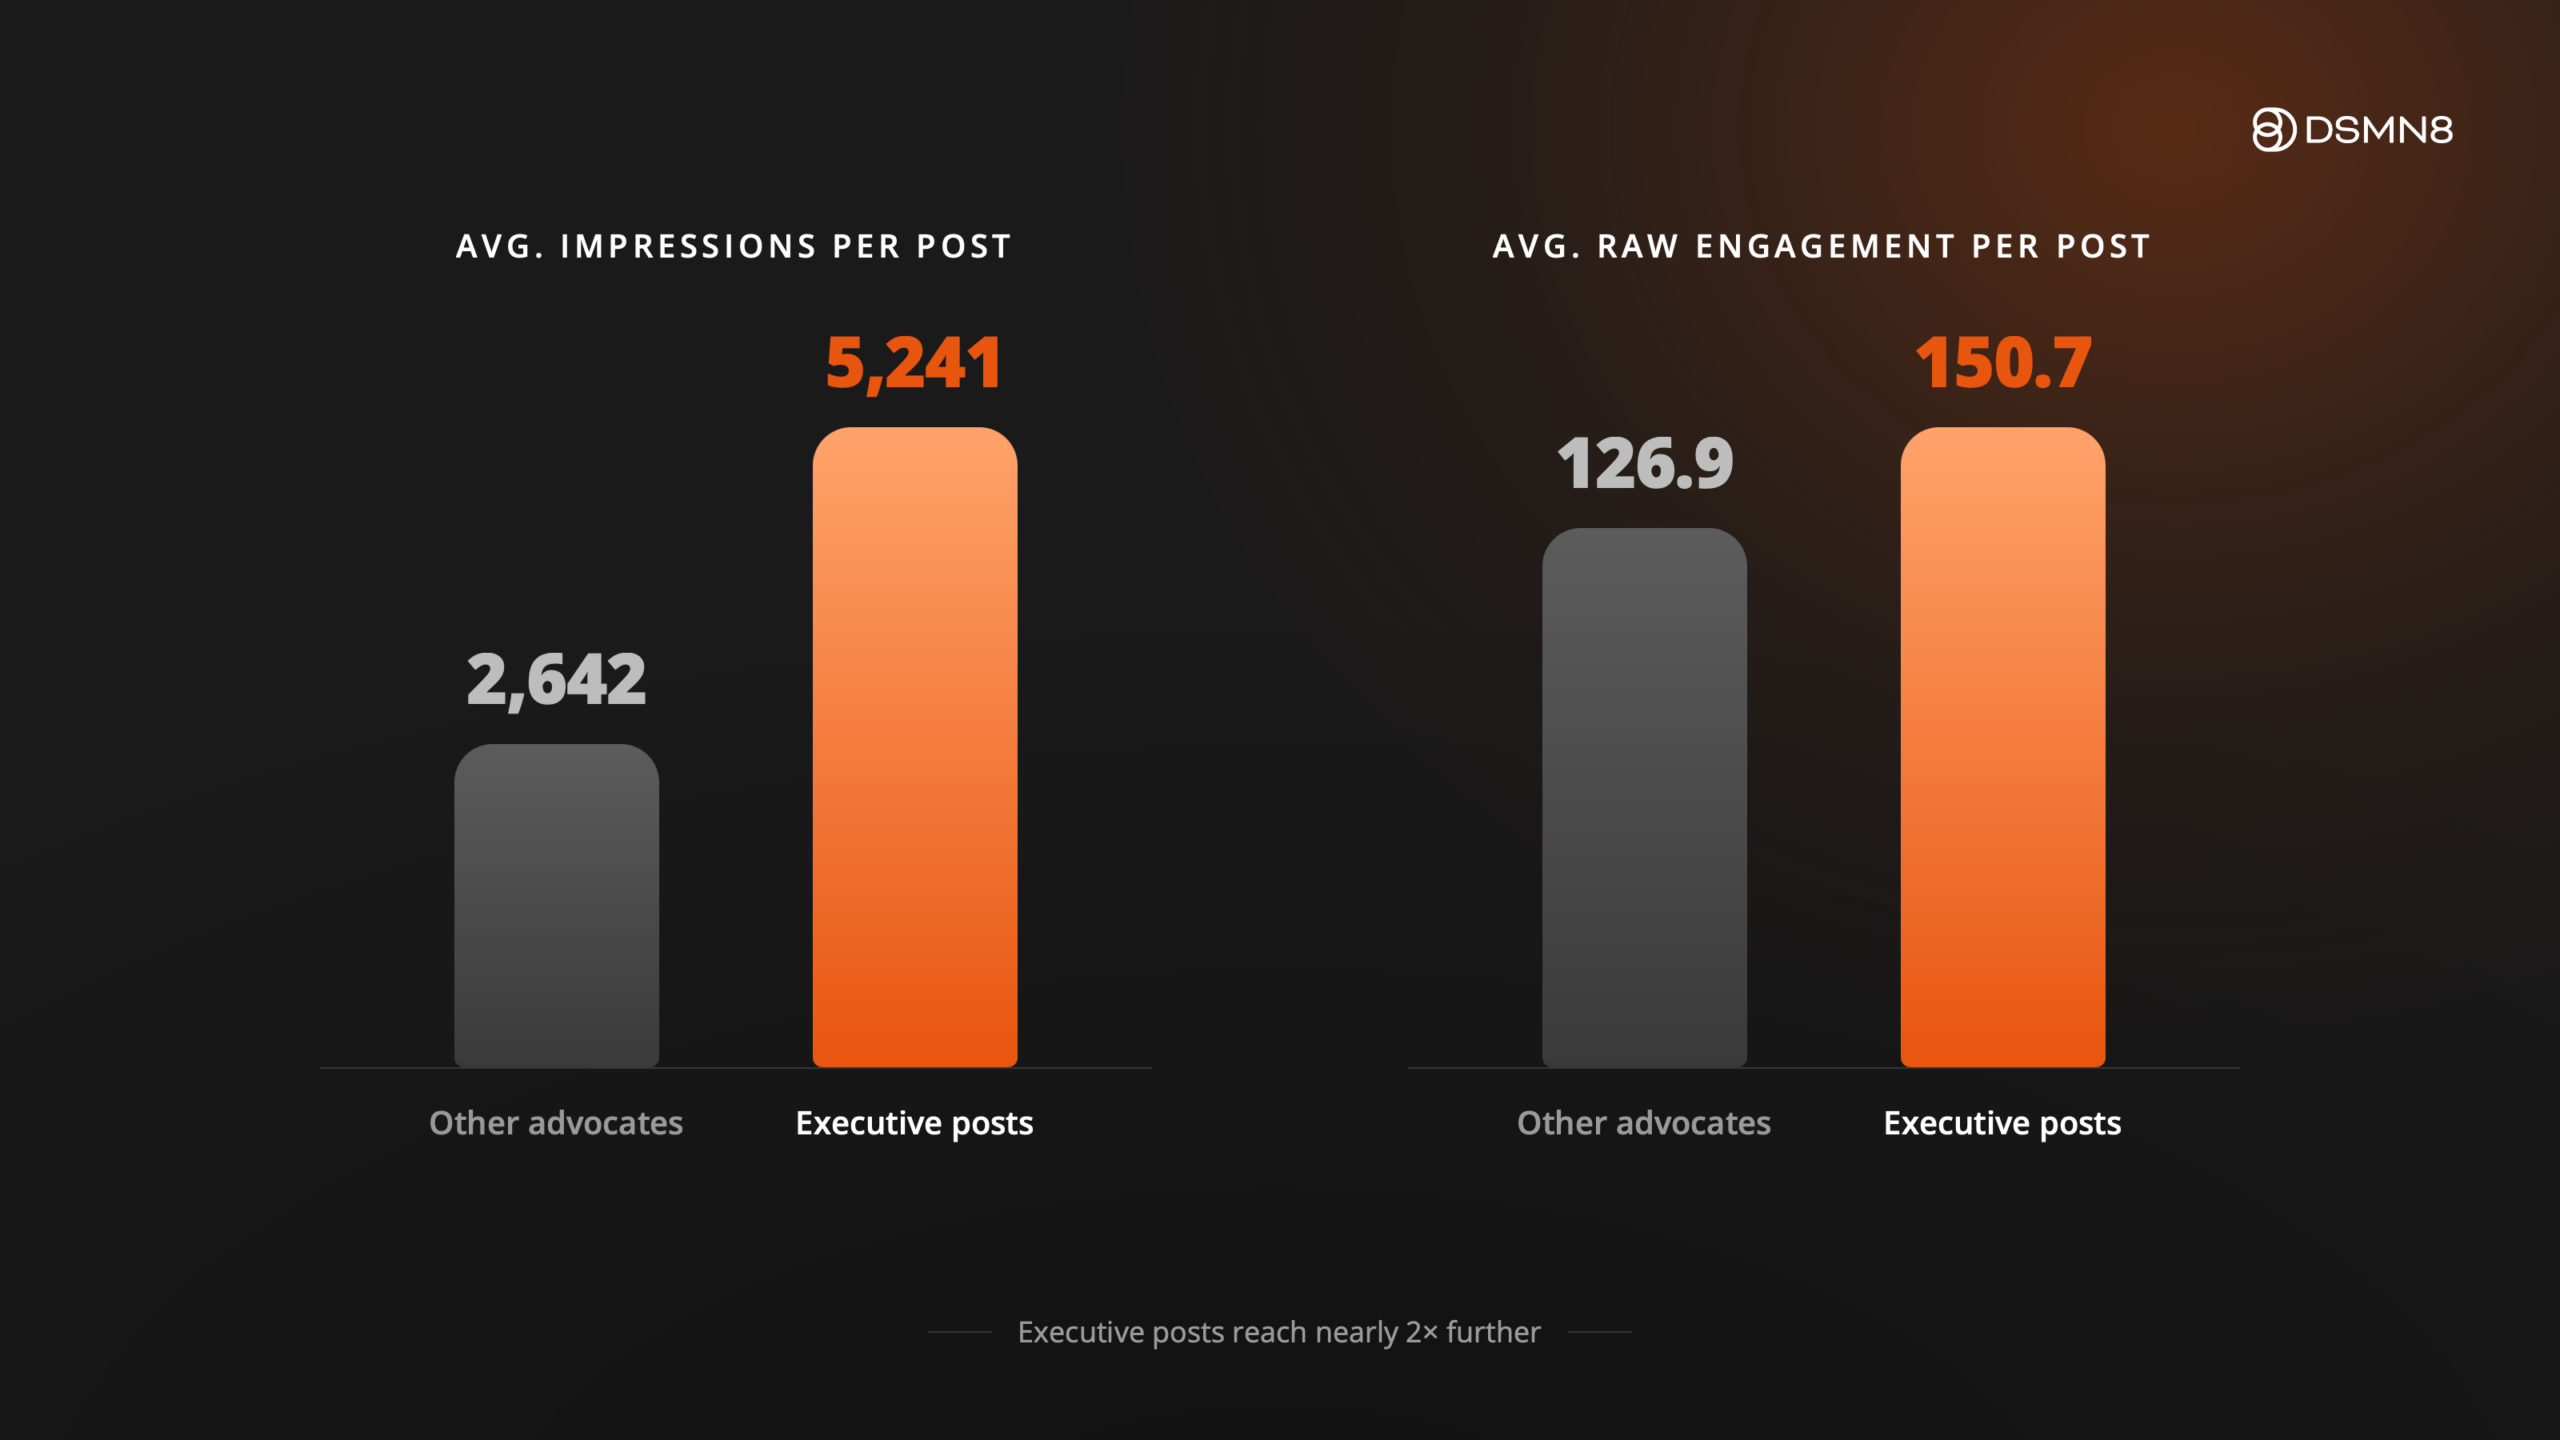
Executive posts averaged 5,241 impressions, compared with 2,642 for other employee advocates in the same 62 organizations.
That’s 98% more reach per post.
Raw engagement (reactions, comments, and clicks combined) was higher too, at 150.7 per executive post vs 126.9 for other advocates, around 1.2x.
Adding senior leaders to an existing employee advocacy program gives it a reach boost from day one. It’s no surprise that this was the top priority for program leaders in our 2026 Benchmark Study.
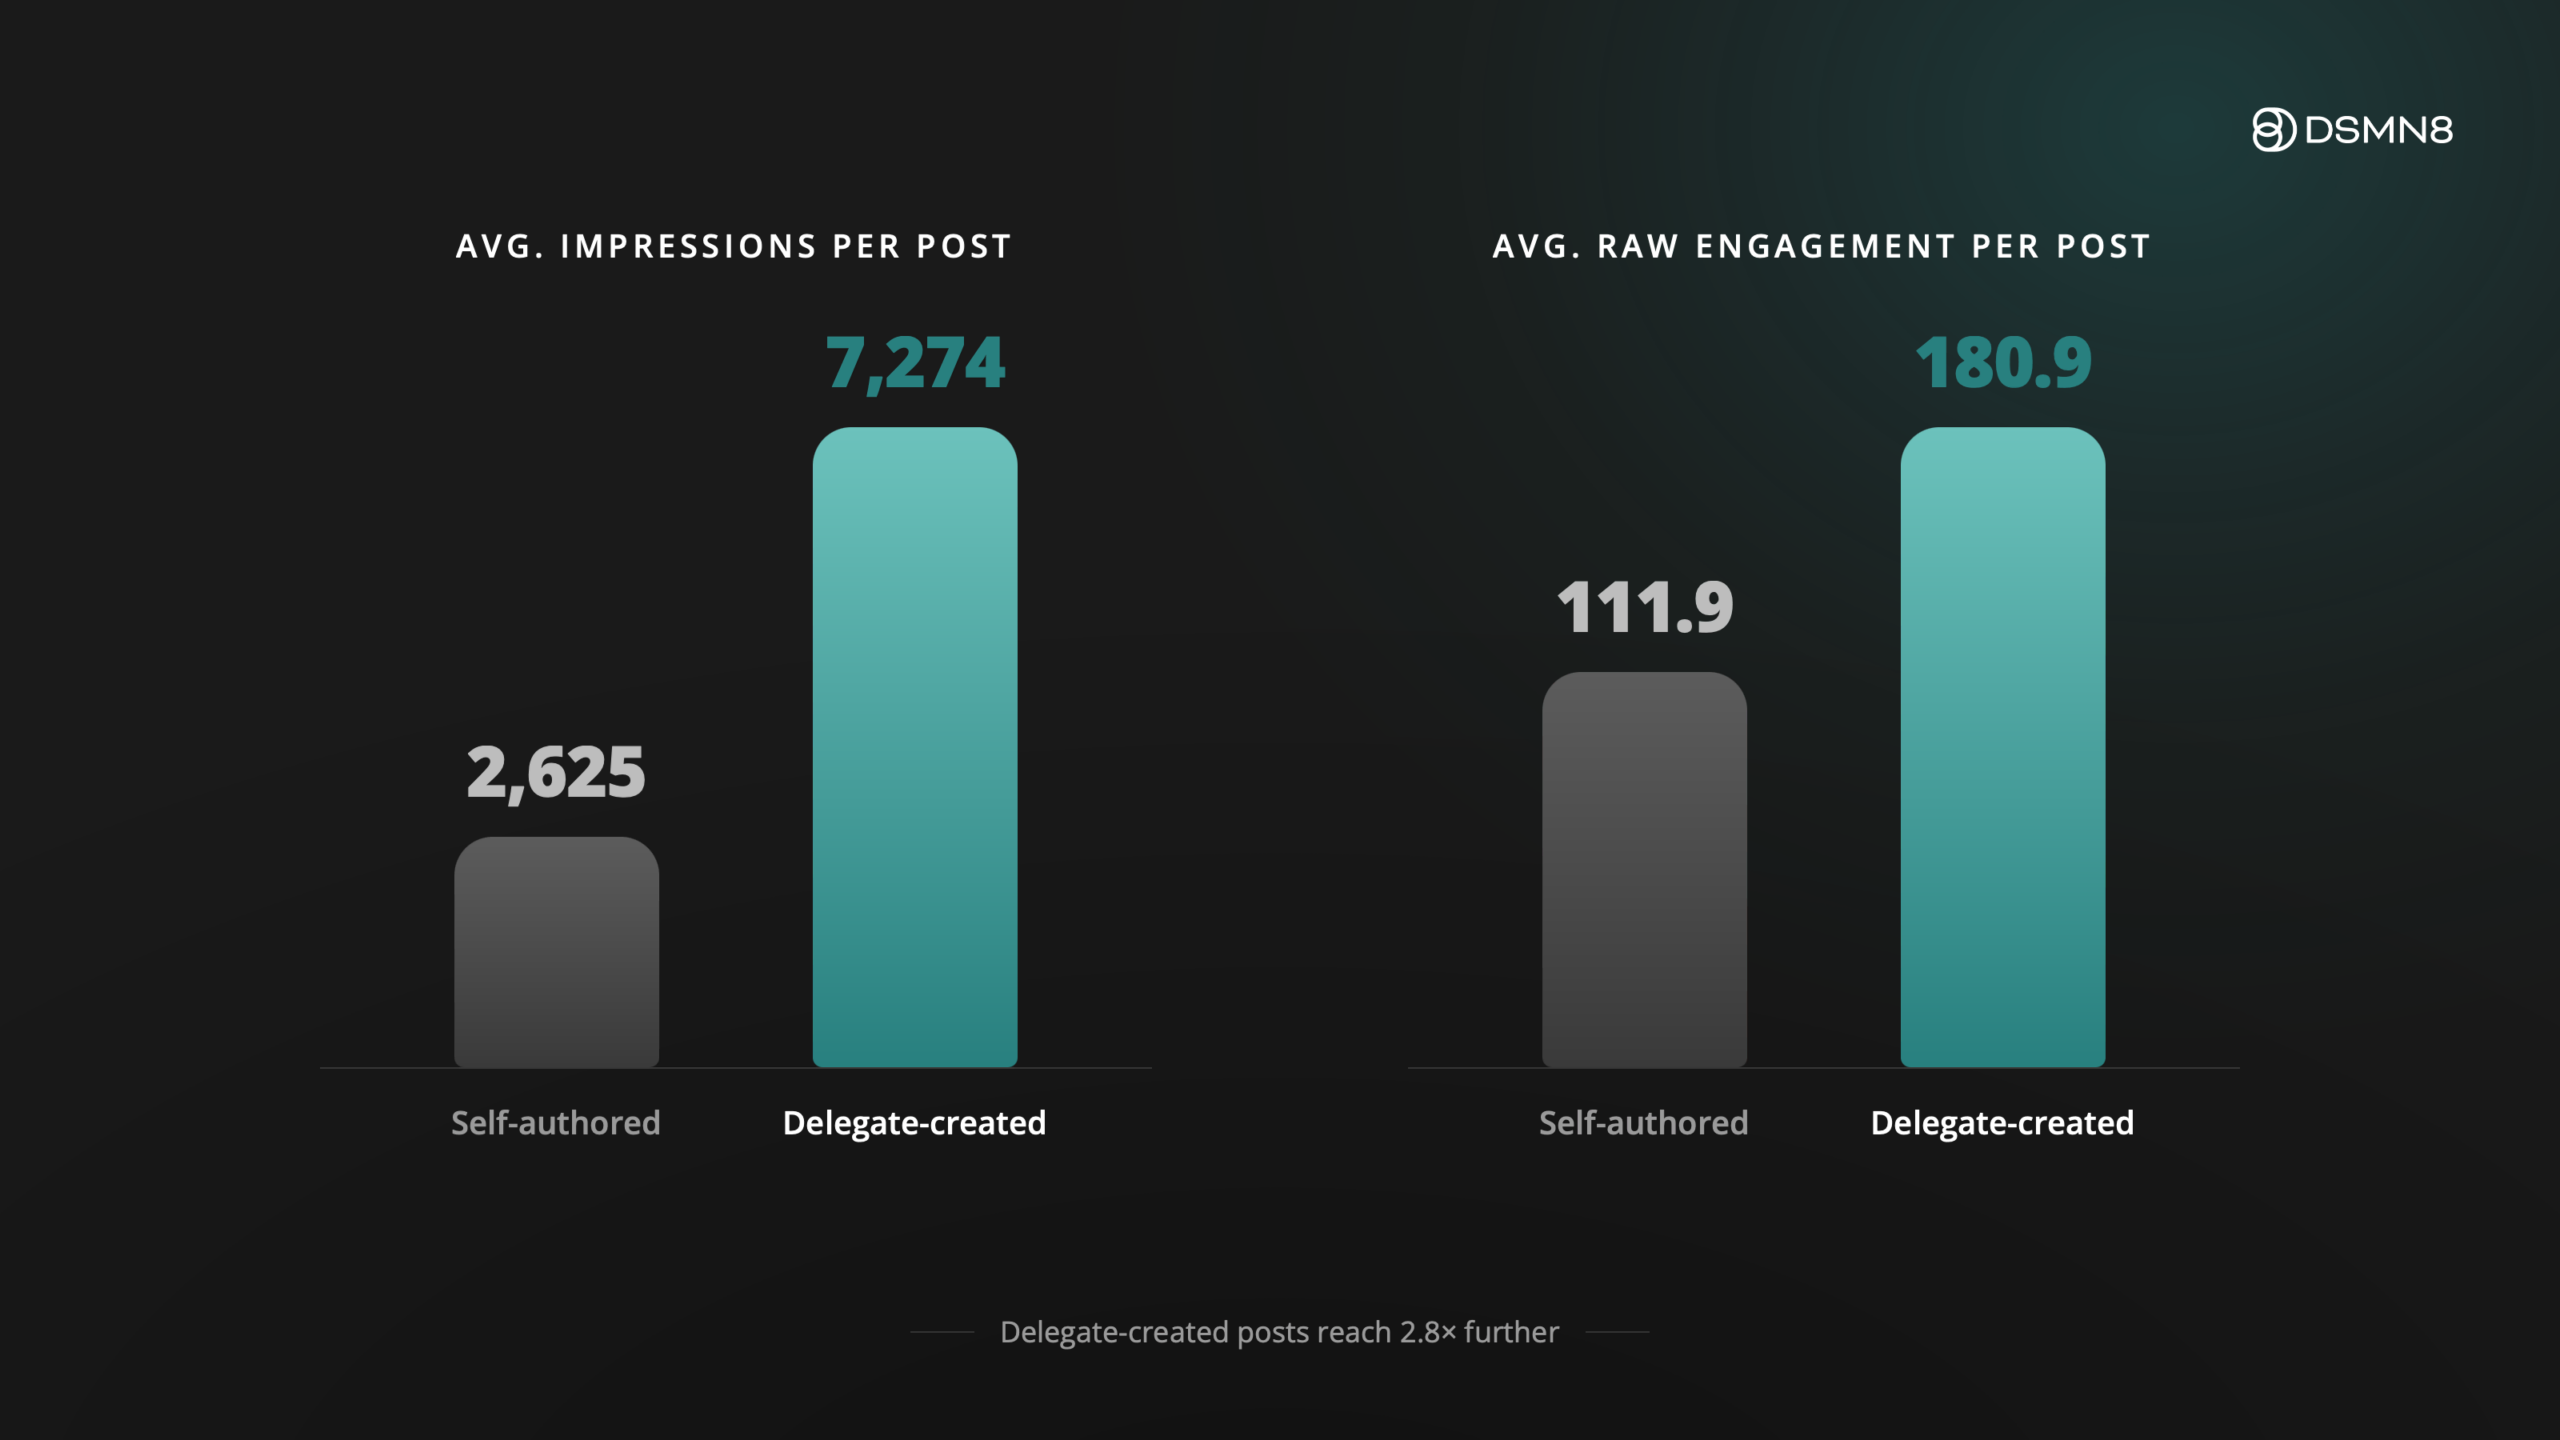
Delegate-created executive posts averaged 7,274 impressions, compared with 2,625 for posts executives wrote themselves.
That’s roughly 2.8x the reach. Raw engagement followed the same direction, at 180.9 vs 111.9 per post (around 1.6x).
The likely reason? Most delegates sit in marketing or communications. Writing for social media is already part of their day job. They know what works.
Engagement rate tells a more nuanced story. Because delegate-created posts reach so many more people, their overall engagement rate sits at 2.49%, compared with 4.26% for self-authored posts and the 4.80% employee advocate benchmark (the average across 51,335 employee posts in the same 62 organizations).
Individual delegate accounts ranged from 1.22% to 20.99%, spanning well below and well above the 4.80% benchmark.
Posting Pace Shapes Engagement Rate
One pattern stands out clearly: how often each account posts.
The three highest-volume delegate accounts (40+ posts each) posted between 1.2 and 1.9 times per week. Their engagement rates were 1.22%, 1.54%, and 2.58%.
One of the strongest-performing accounts hit a 20.99% engagement rate, by only posting 17 times.
The same pattern showed up when we ranked executive accounts by average raw engagement per post (excluding accounts with fewer than 10 posts, so one lucky post couldn’t skew the result).
Posts made by account
Avg. engagement per post
70
59
51
122
27
266
12
375
16
654
More posts didn’t mean more engagement per post.
Our data points toward deliberate over frequent posting. Though it is worth testing case by case, since a given leader’s existing profile strength will be a factor here too.
Gallery Posts: The Format Executives Are Underusing
We also compared average engagement per shared post against how often each format is used.
Format
Avg. engagement per post
Share of content
Gallery
98
13%
Image
91
43%
Link / URL
82
16%
Text-only
69
6%
Video
43
19%
Document
27
4%
Gallery posts (multiple images a viewer can swipe through) earned the highest average engagement of any format at 98.44, driven by the strongest reactions. Yet they make up just 13.4% of shares, less than a third as often as images.
Images are the default choice at 42.6% of all content shared, and they hold up well at 90.58 average engagement.
Link posts drive 38.31 clicks on average, more than double any other format, with fewer reactions and comments. Use them when website traffic is the goal.
Text-only posts make up 12.7% of executives’ own posts vs 5.9% of the broader share mix. That fits their role as personal, in-the-moment commentary.
Documents (e.g. carousels and slide decks) were the weakest performer, with the lowest reactions, comments, and overall engagement.
This largely echoes our What’s Working on LinkedIn in 2026 report, which analyzed 110,000 employee LinkedIn posts. Gallery and document posts rank the same way in both datasets, while text posts are more common among senior leaders.
What This Means for Your Executive Influencer Program
Executive reach arrives almost as soon as a program is active. The bigger lever is the pace and content format behind it.
Start with executives who rarely post
Identify leaders who’ve only posted a handful of times this year. That’s the clearest, lowest-effort win available. Delegate-created posts in this dataset reached roughly 2.8x further than self-authored ones. With Delegate Access Controls, a trusted team member can post on an executive’s behalf with no password sharing and a full audit trail.
Choose a steady pace over a high frequency
The busiest delegate accounts had the lowest engagement rates. If you’re deciding between posting more often and posting more deliberately, the data points toward deliberate, though it’s worth testing case by case for your own program.
Build one gallery post into every content batch
If your team has an events or culture photo library sitting unused, a multi-image gallery is an easy swap for a single image post. It was the strongest-performing format in this dataset.
Check each delegate account against 4.80% every quarter
Use the 4.80% employee advocate benchmark as a floor to watch for. An account consistently well below it is worth a closer look at pace and content mix. DSMN8’s analytics track this per account, so the check takes a dashboard glance.
“The biggest lesson to scaling is that you need technology. When we launched it, it was just a pilot, and I used to joke that it was held together with duct tape and paper clips. It grew very quickly, and just as quickly as it grew, it became very unwieldy.”
The full report includes the account-level engagement breakdowns, format-by-format performance data, real examples of what strong executive posts look like, and recommendations you can hand to your program admins this week.
Most don’t, at least not entirely. Delegates author 56% of executive posts, while executives personally publish 62% of shares. Delegate-created posts also reached about 2.8x more impressions than self-authored ones, likely because delegates tend to work in marketing or comms.
Is It OK to Use a Ghostwriter for Executive LinkedIn Content?
Yes, and it’s common practice. In this data, executives still publish 62% of shares themselves, so most programs keep leaders involved in what goes out under their name. Delegate access lets a team member draft and share on a leader’s behalf with no password sharing and a full audit trail.
Do Executive LinkedIn Posts Get More Reach Than Employee Posts?
Yes. Executive posts averaged 5,241 impressions vs 2,642 for other employee advocates in the same organizations, 98% more reach per post. Raw engagement was around 1.2x higher.
What Is the Best LinkedIn Post Format for Executives?
Gallery posts earned the highest average engagement (98.44) and the strongest reactions, yet made up only 13.4% of shares. Images are the most used format (42.6%) and also perform well. Link posts drive the most clicks, at 38.31 on average.
Emily Neal
Emily is SEO Lead at DSMN8. She focuses on organic growth strategy across search and AI search and co-authors DSMN8's original research, including the Employee Advocacy Benchmark Report and edited CEO Bradley Keenan's book. Her background spans SEO strategy, technical web, long-form content, digital PR, and marketing automation.