What's on this page:
- Why Employee Advocacy Reports are Important.
- Exploring DSMN8’s Employee Advocacy Analytics Suite.
- Program Analytics Dashboard.
- Campaigns, Events & UTMs.
- Personal User Analytics.
- Employee Advocacy Newsletter Analytics.
- 5 Ways to Use Employee Advocacy Reports for Content Ideas.
- Employee Advocacy Benchmarks.
- Additional Resources.
Last updated: 20th Jan 2026
One of the most common questions that comes up when considering employee advocacy as a marketing strategy is “How can I track the results?” 🤔
Monitoring key performance metrics and user adoption is essential for scaling your program, demonstrating the impact to leadership, and improving your content strategy.
We’ve written about the key employee advocacy metrics to track, but today we’re going to dive deeper by demonstrating how DSMN8’s analytics suite works and how to effectively use employee advocacy reports to improve your content.
Why Employee Advocacy Reports are Important
Before we talk about the ways to monitor employee advocacy program performance and the analytics dashboard in DSMN8, it’s important to understand why we’d want to report on this in the first place.
In our experience, employee advocacy program managers should aim to track and report on these three areas: users, content, and ROI.
Let’s jump into each area, the relevant metrics to look at for each, and why they’re important to keep an eye on👇

User Metrics
User adoption and sustained employee engagement are critical to your program’s success.
Having visibility into the nuances of your active user count helps determine whether your program is growing, stable, or declining.
Keep in mind that as your program matures, onboarding new advocates will be essential to maintain steady user levels, considering employee turnover.
Relevant metrics to track:
- Total Users.
- Engaged Users.
- New Sign Ups.
- Top Users.
- You should also consider anecdotal feedback here to gauge how your program is perceived internally.
Content Metrics
Next are the metrics your social media manager and marketing team will be most interested in: content performance.
Whether your program is managed by marketing or not, these figures are important for an employee advocacy program manager to know.
They’ll help you understand which content is working for your organization, empowering you to take a data-driven approach to content creation.
Relevant metrics to track:
- Shares.
- Reach.
- Engagement (likes, comments).
- Clicks.
- Audience size.
These numbers all show how successful your content is on social media.
Diving into this data can generate new content ideas, identify which formats are performing best, and reveal which content employees are most interested in sharing.
These analytics are a goldmine for those in your team creating content for your program.
ROI Metrics
And finally, the part that leadership teams are most keen to see: ROI.
Understanding the return on investment of your employee advocacy program and how it compares with paid social media advertising is essential to maintaining leadership buy-in.
Relevant metrics to track:
- Earned media value.
- Comparative cost-per-click.
- Business results from employee shares (conversions, sales).
Exploring DSMN8's Employee Advocacy Analytics Suite
Below is a comprehensive overview of the DSMN8 Analytics Suite for monitoring your program results at the program level, by teams and groups, and at the individual level.
We’ll explore each section and the reports available, then cover how to use the data to inform your content strategy and improve employee engagement.
Program Analytics Dashboard
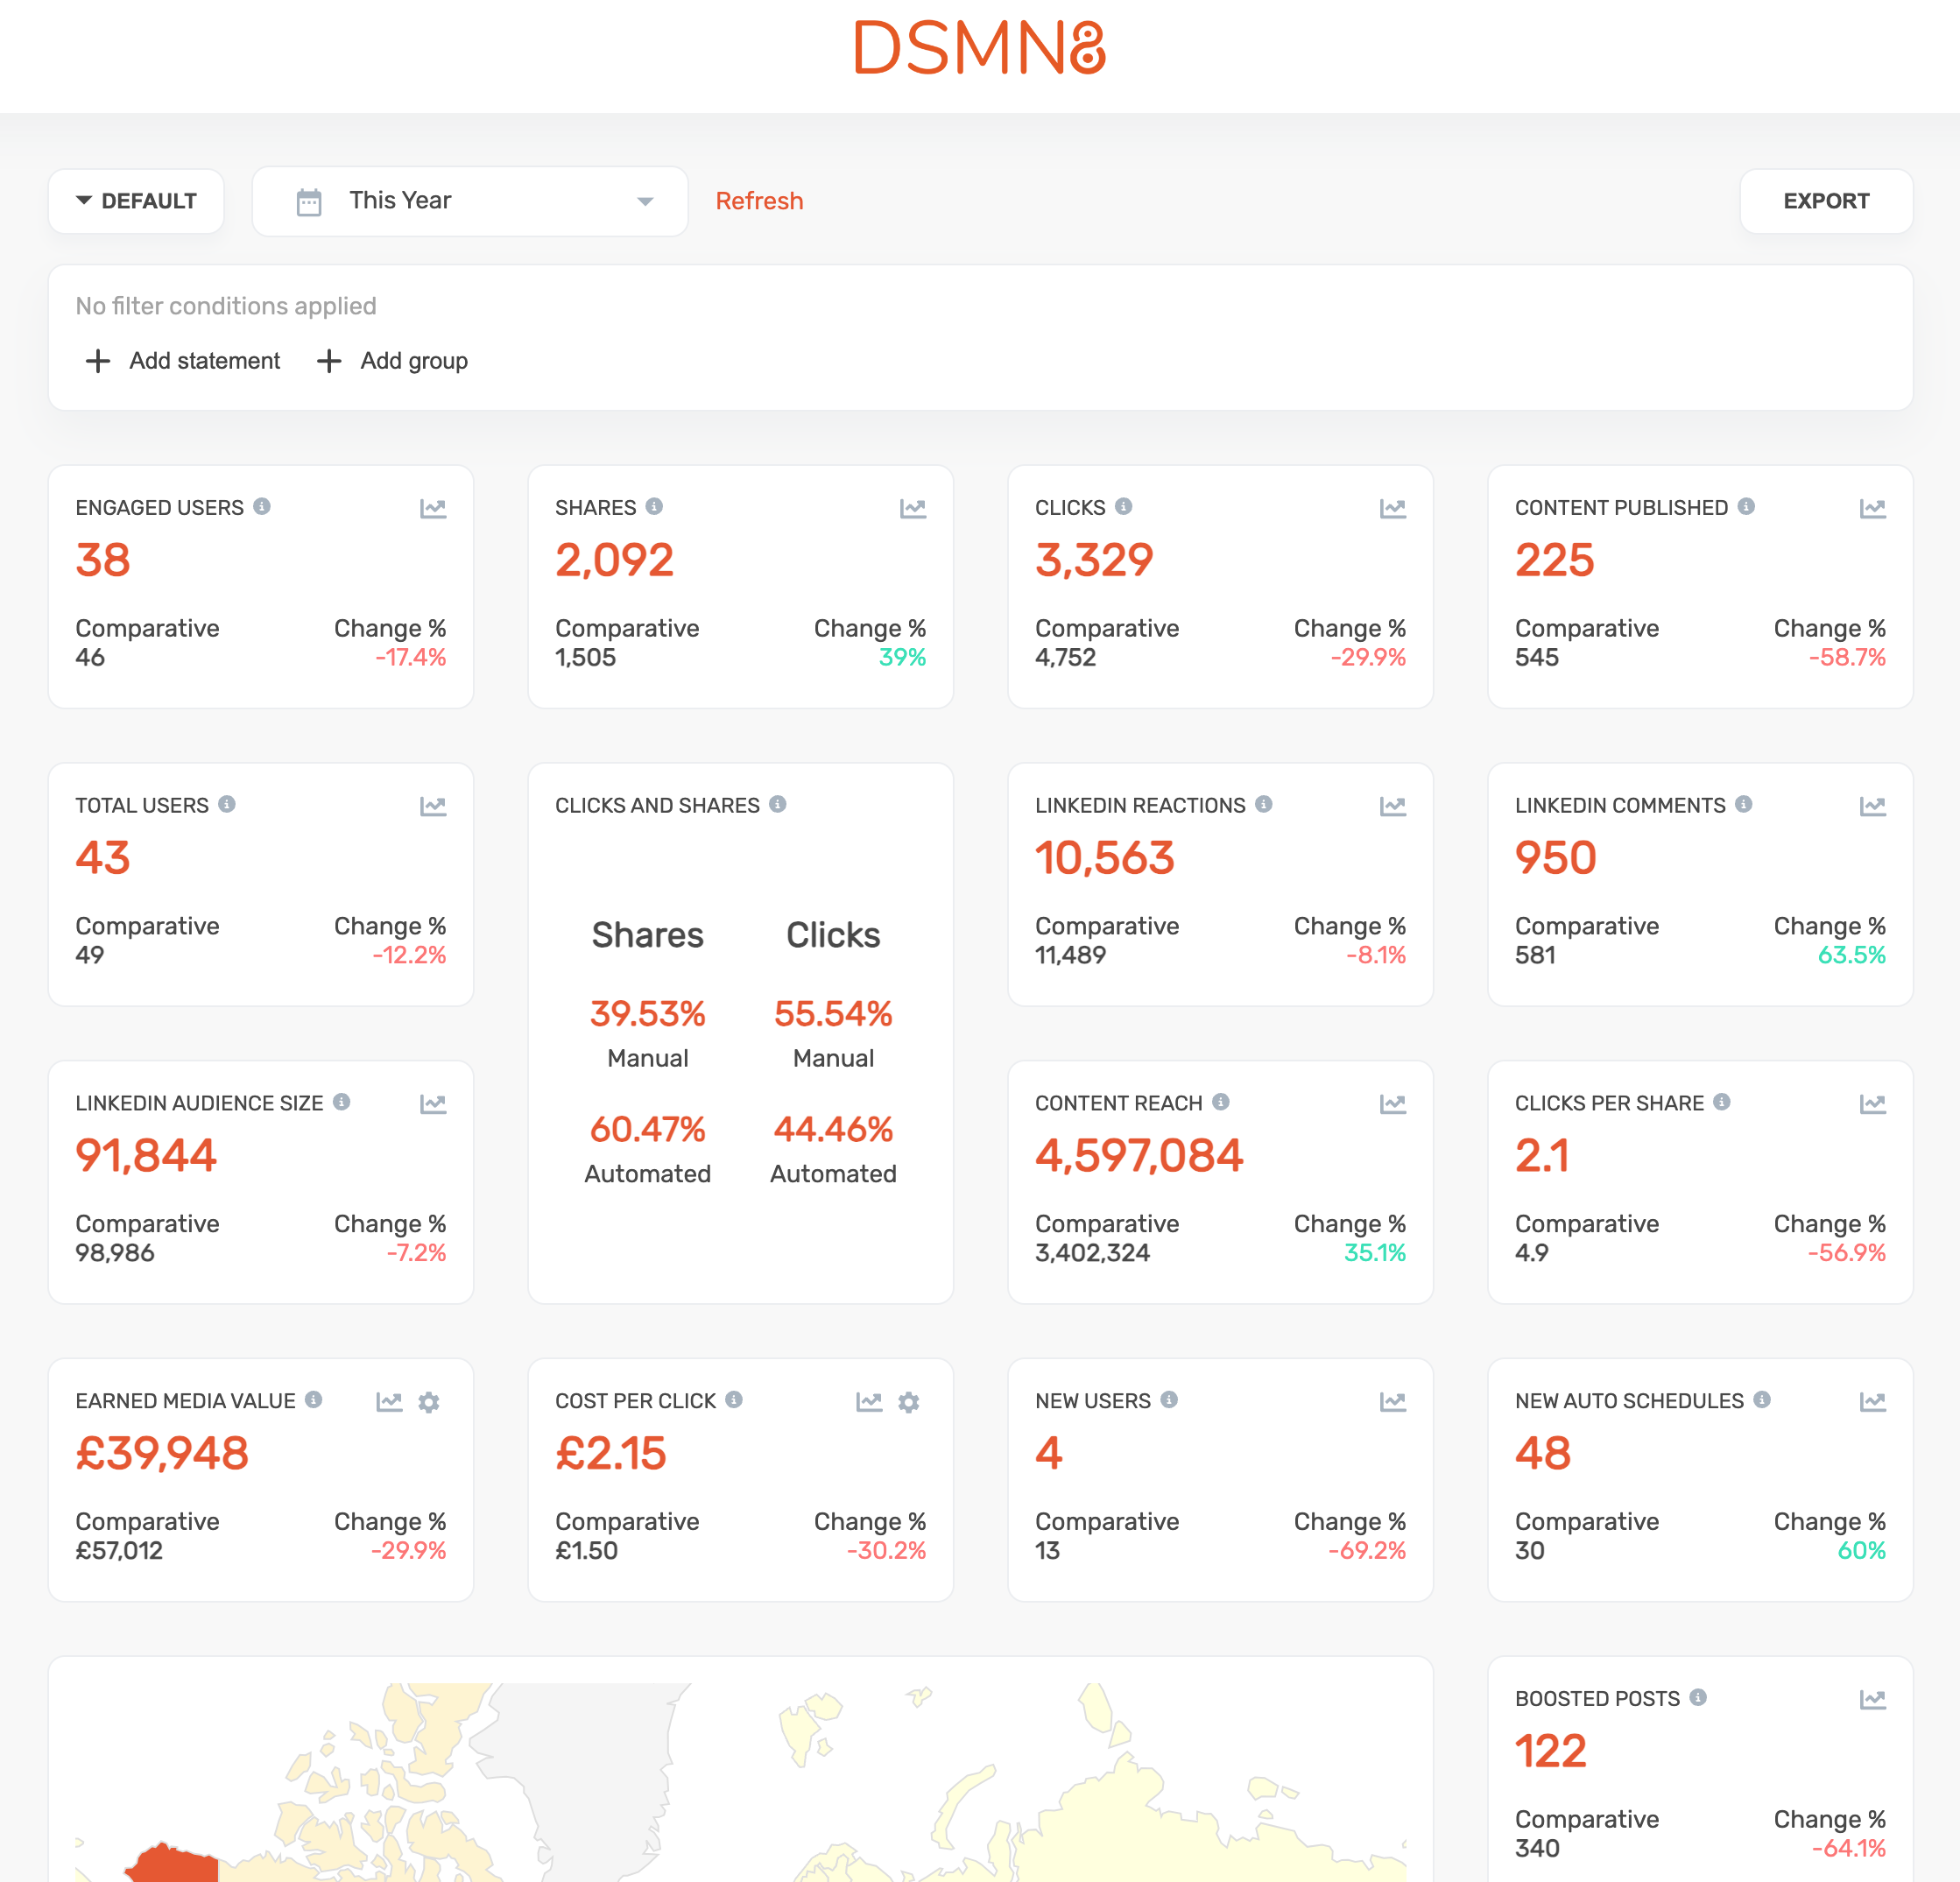
The DSMN8 Analytics Dashboard gives you a complete overview of your employee advocacy program performance.
Here, you can track, measure, and analyze your program’s metrics and data trends.
Note: I will be sharing the standard analytics suite, but you can create multiple tailored dashboards, e.g. for specific teams, and adjust the widgets visible per your needs.
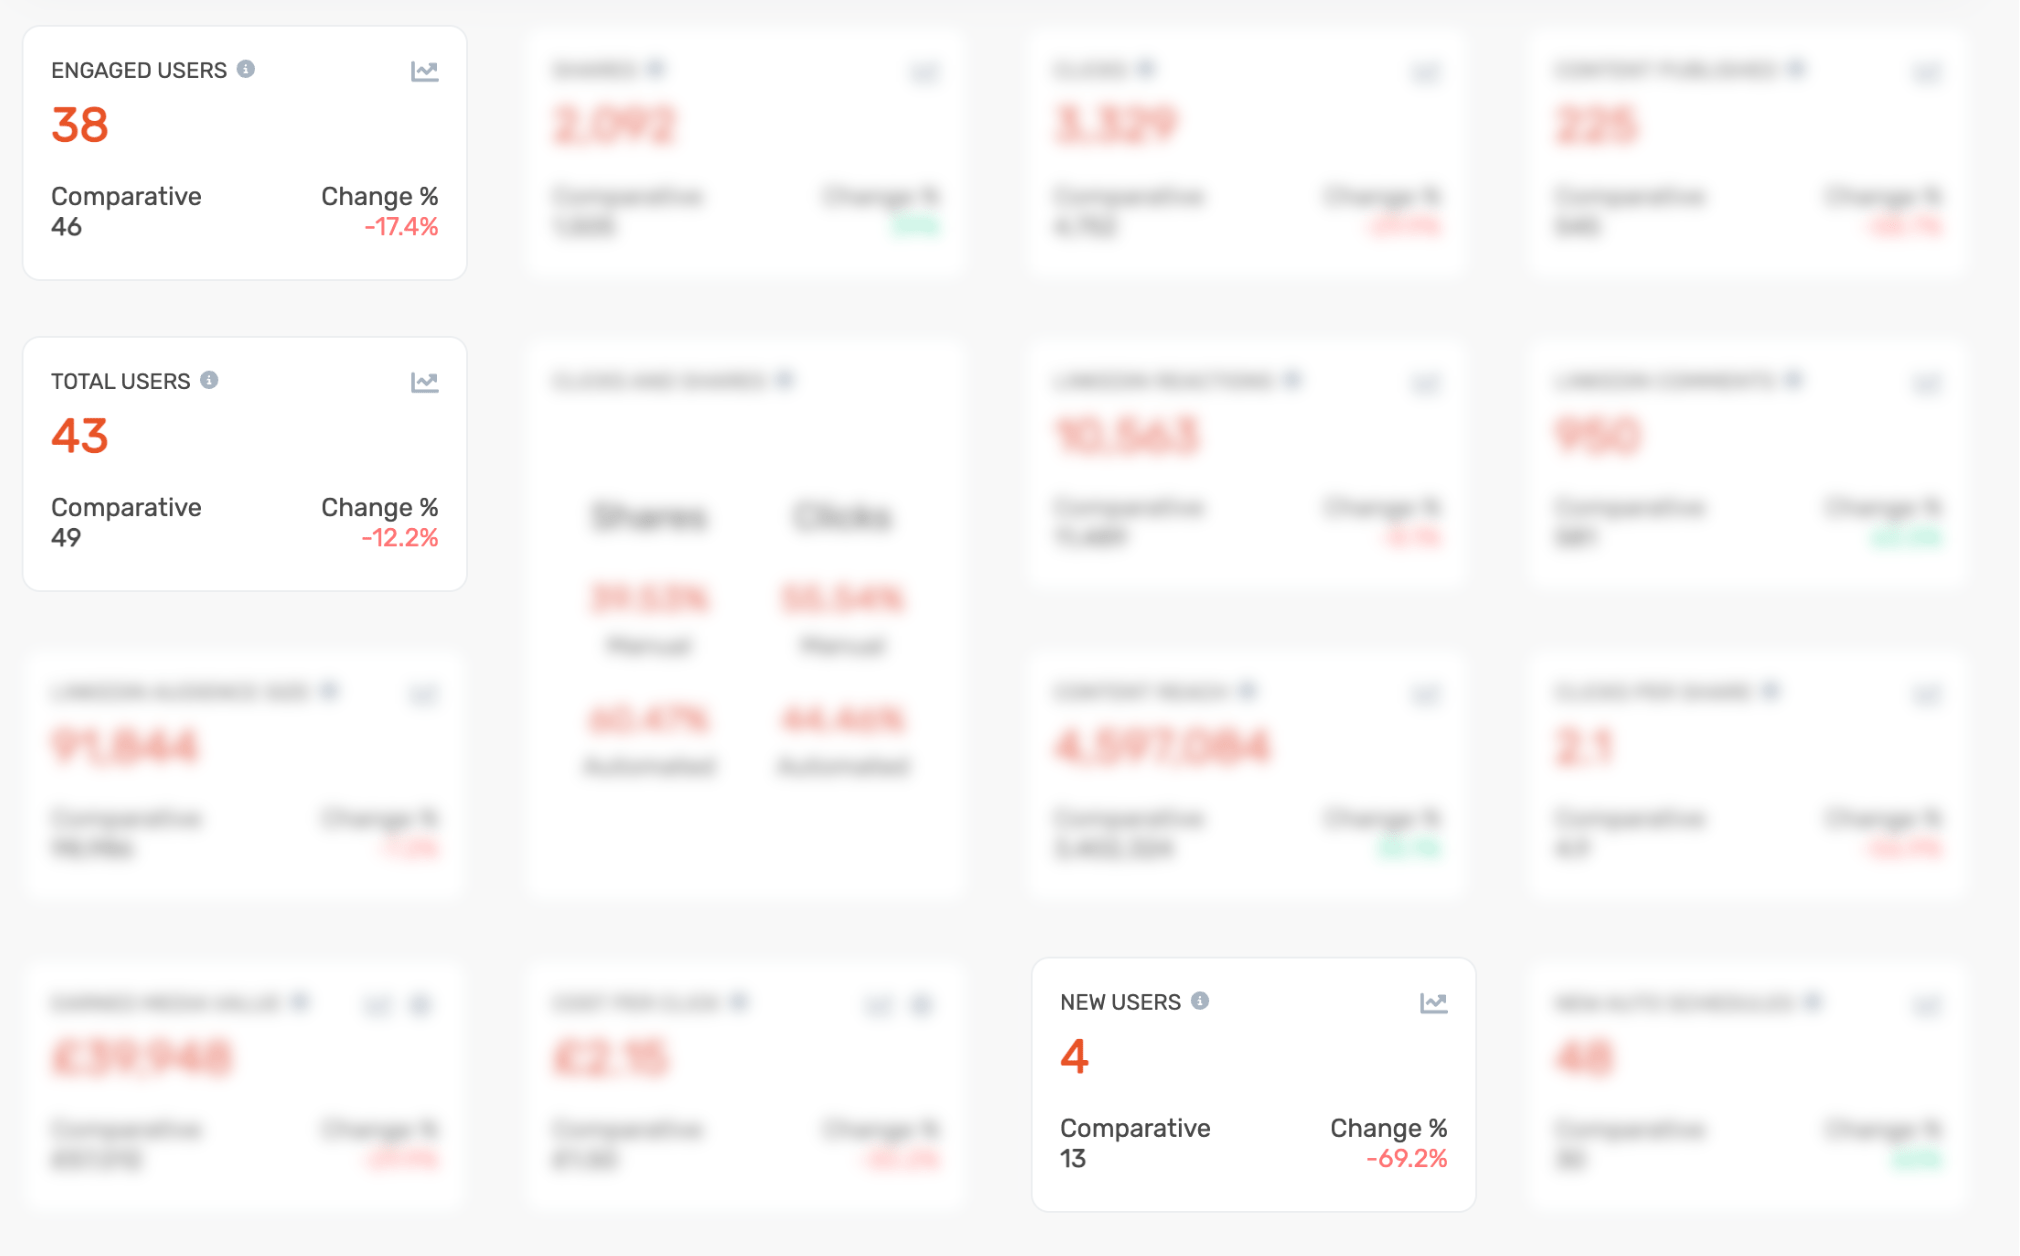
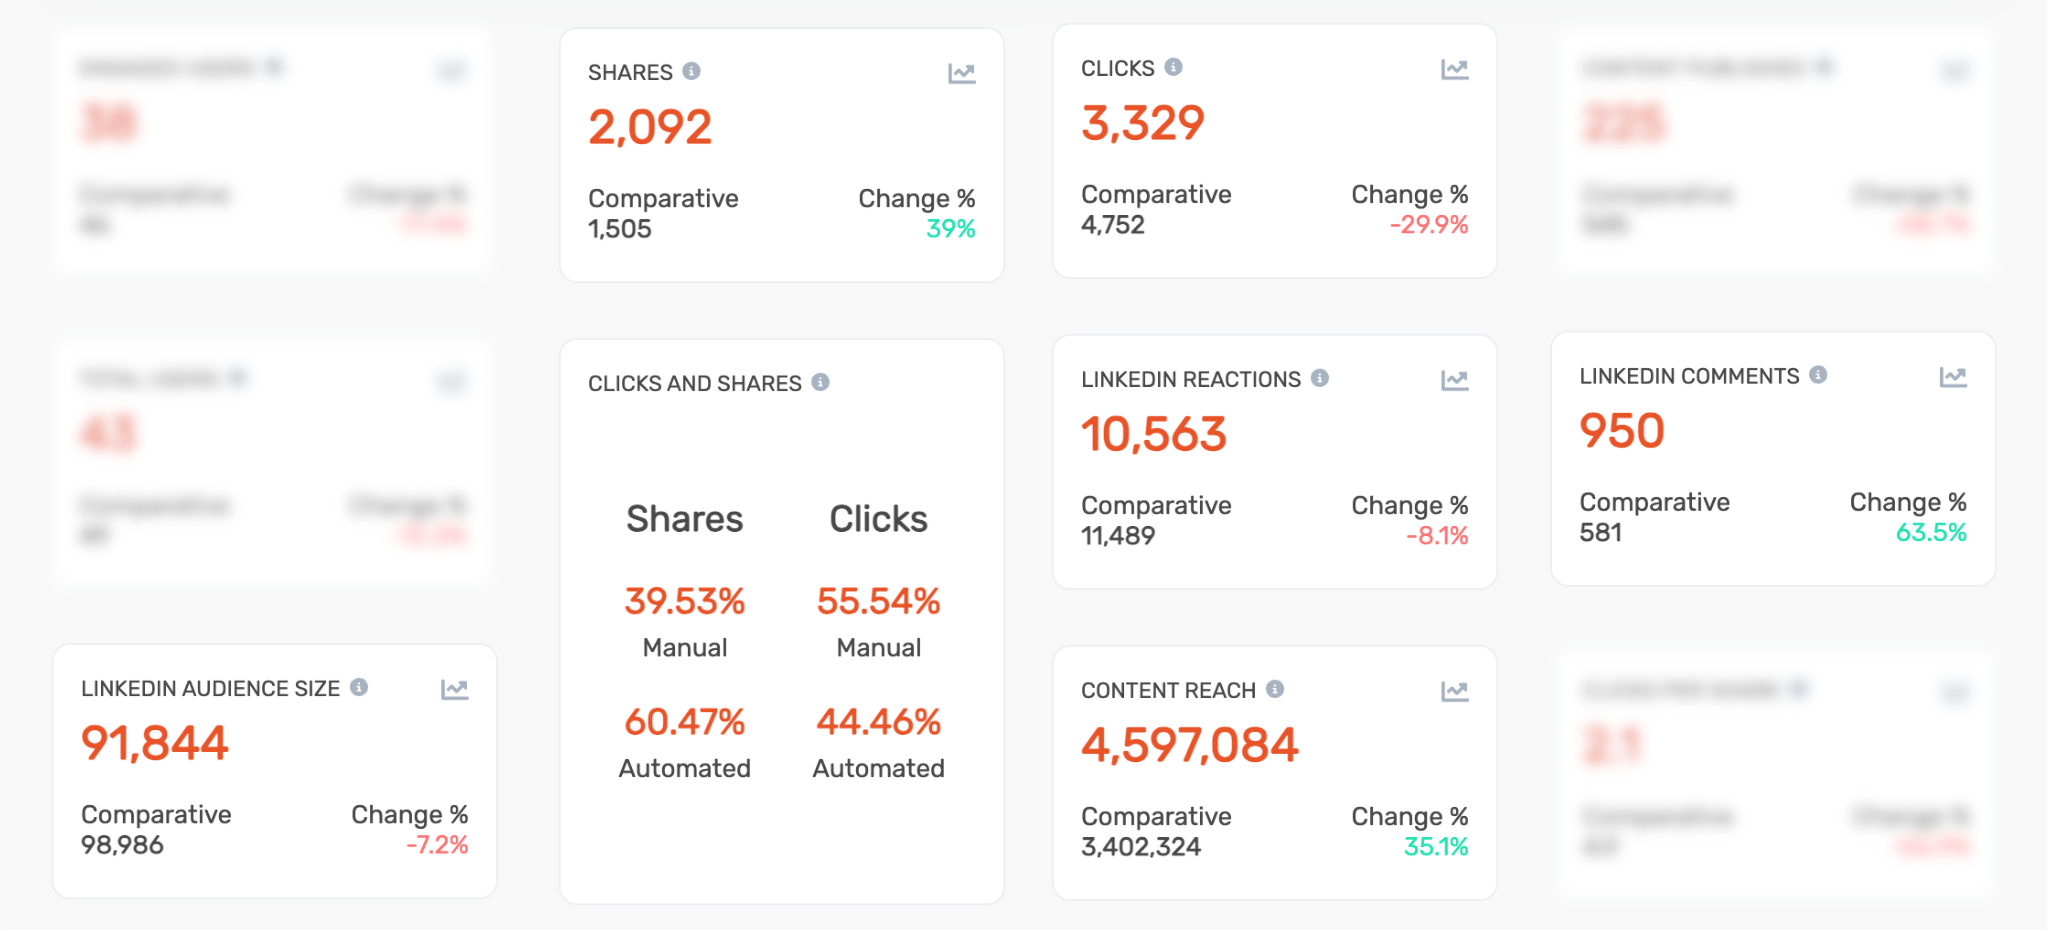
In the first section of your analytics dashboard, you will see the metrics below.
You will also see comparative figures and a percentage increase or decrease, depending on the time period you have selected.
User Metrics:
- Engaged Users.
- Total Users.
- New Users.
- New Auto Schedules. This shows many users have set up automated sharing on LinkedIn.
LinkedIn Metrics:
- LinkedIn Audience Size. This adds up the network size of your advocates to show the total combined audience.
- LinkedIn Reactions.
- LinkedIn Comments.
All Social Media Metrics:
- Shares.
- Clicks.
- Clicks and Shares (Automated vs Manual). This compares results from manually shared content with automated posts.
- Content Reach.
- Content Published.
- Boosted Posts (if using the Boost Post feature).
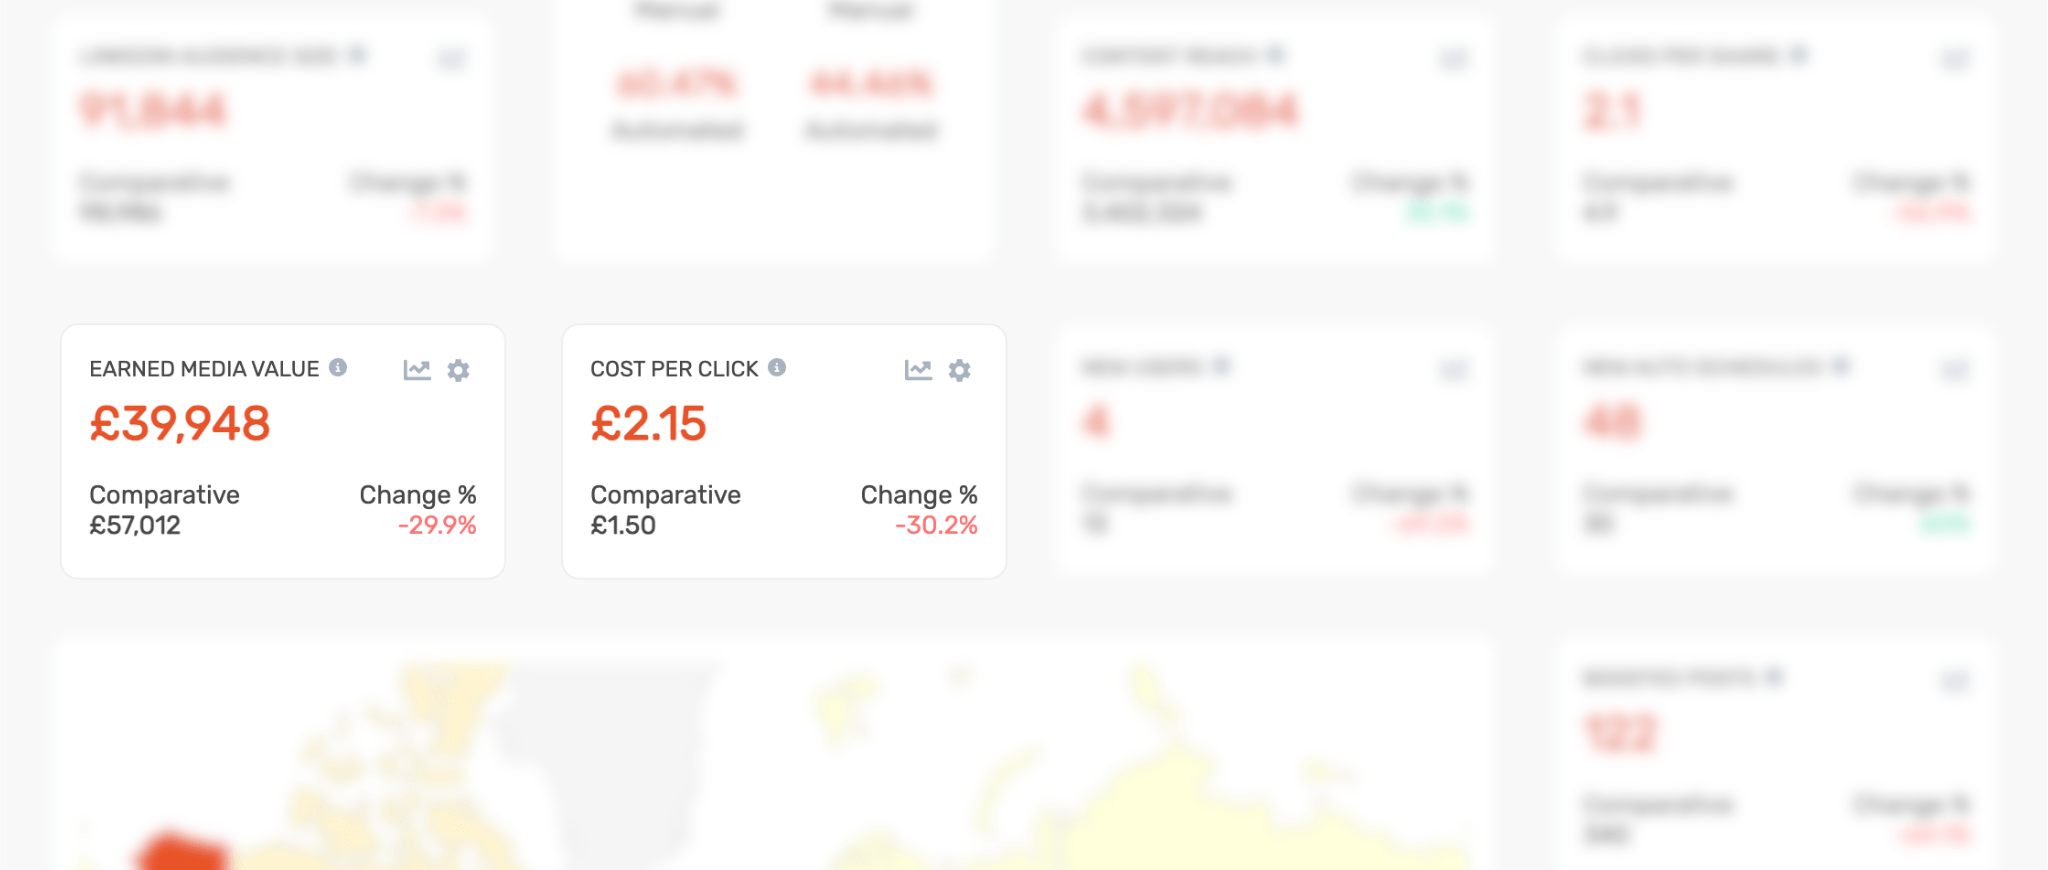
ROI Metrics:
- Earned Media Value (EMV) is what your content clicks would have cost if you had driven the same results through paid advertising.
- Cost Per Click – a comparative metric based on your average cost per click for paid social advertising.
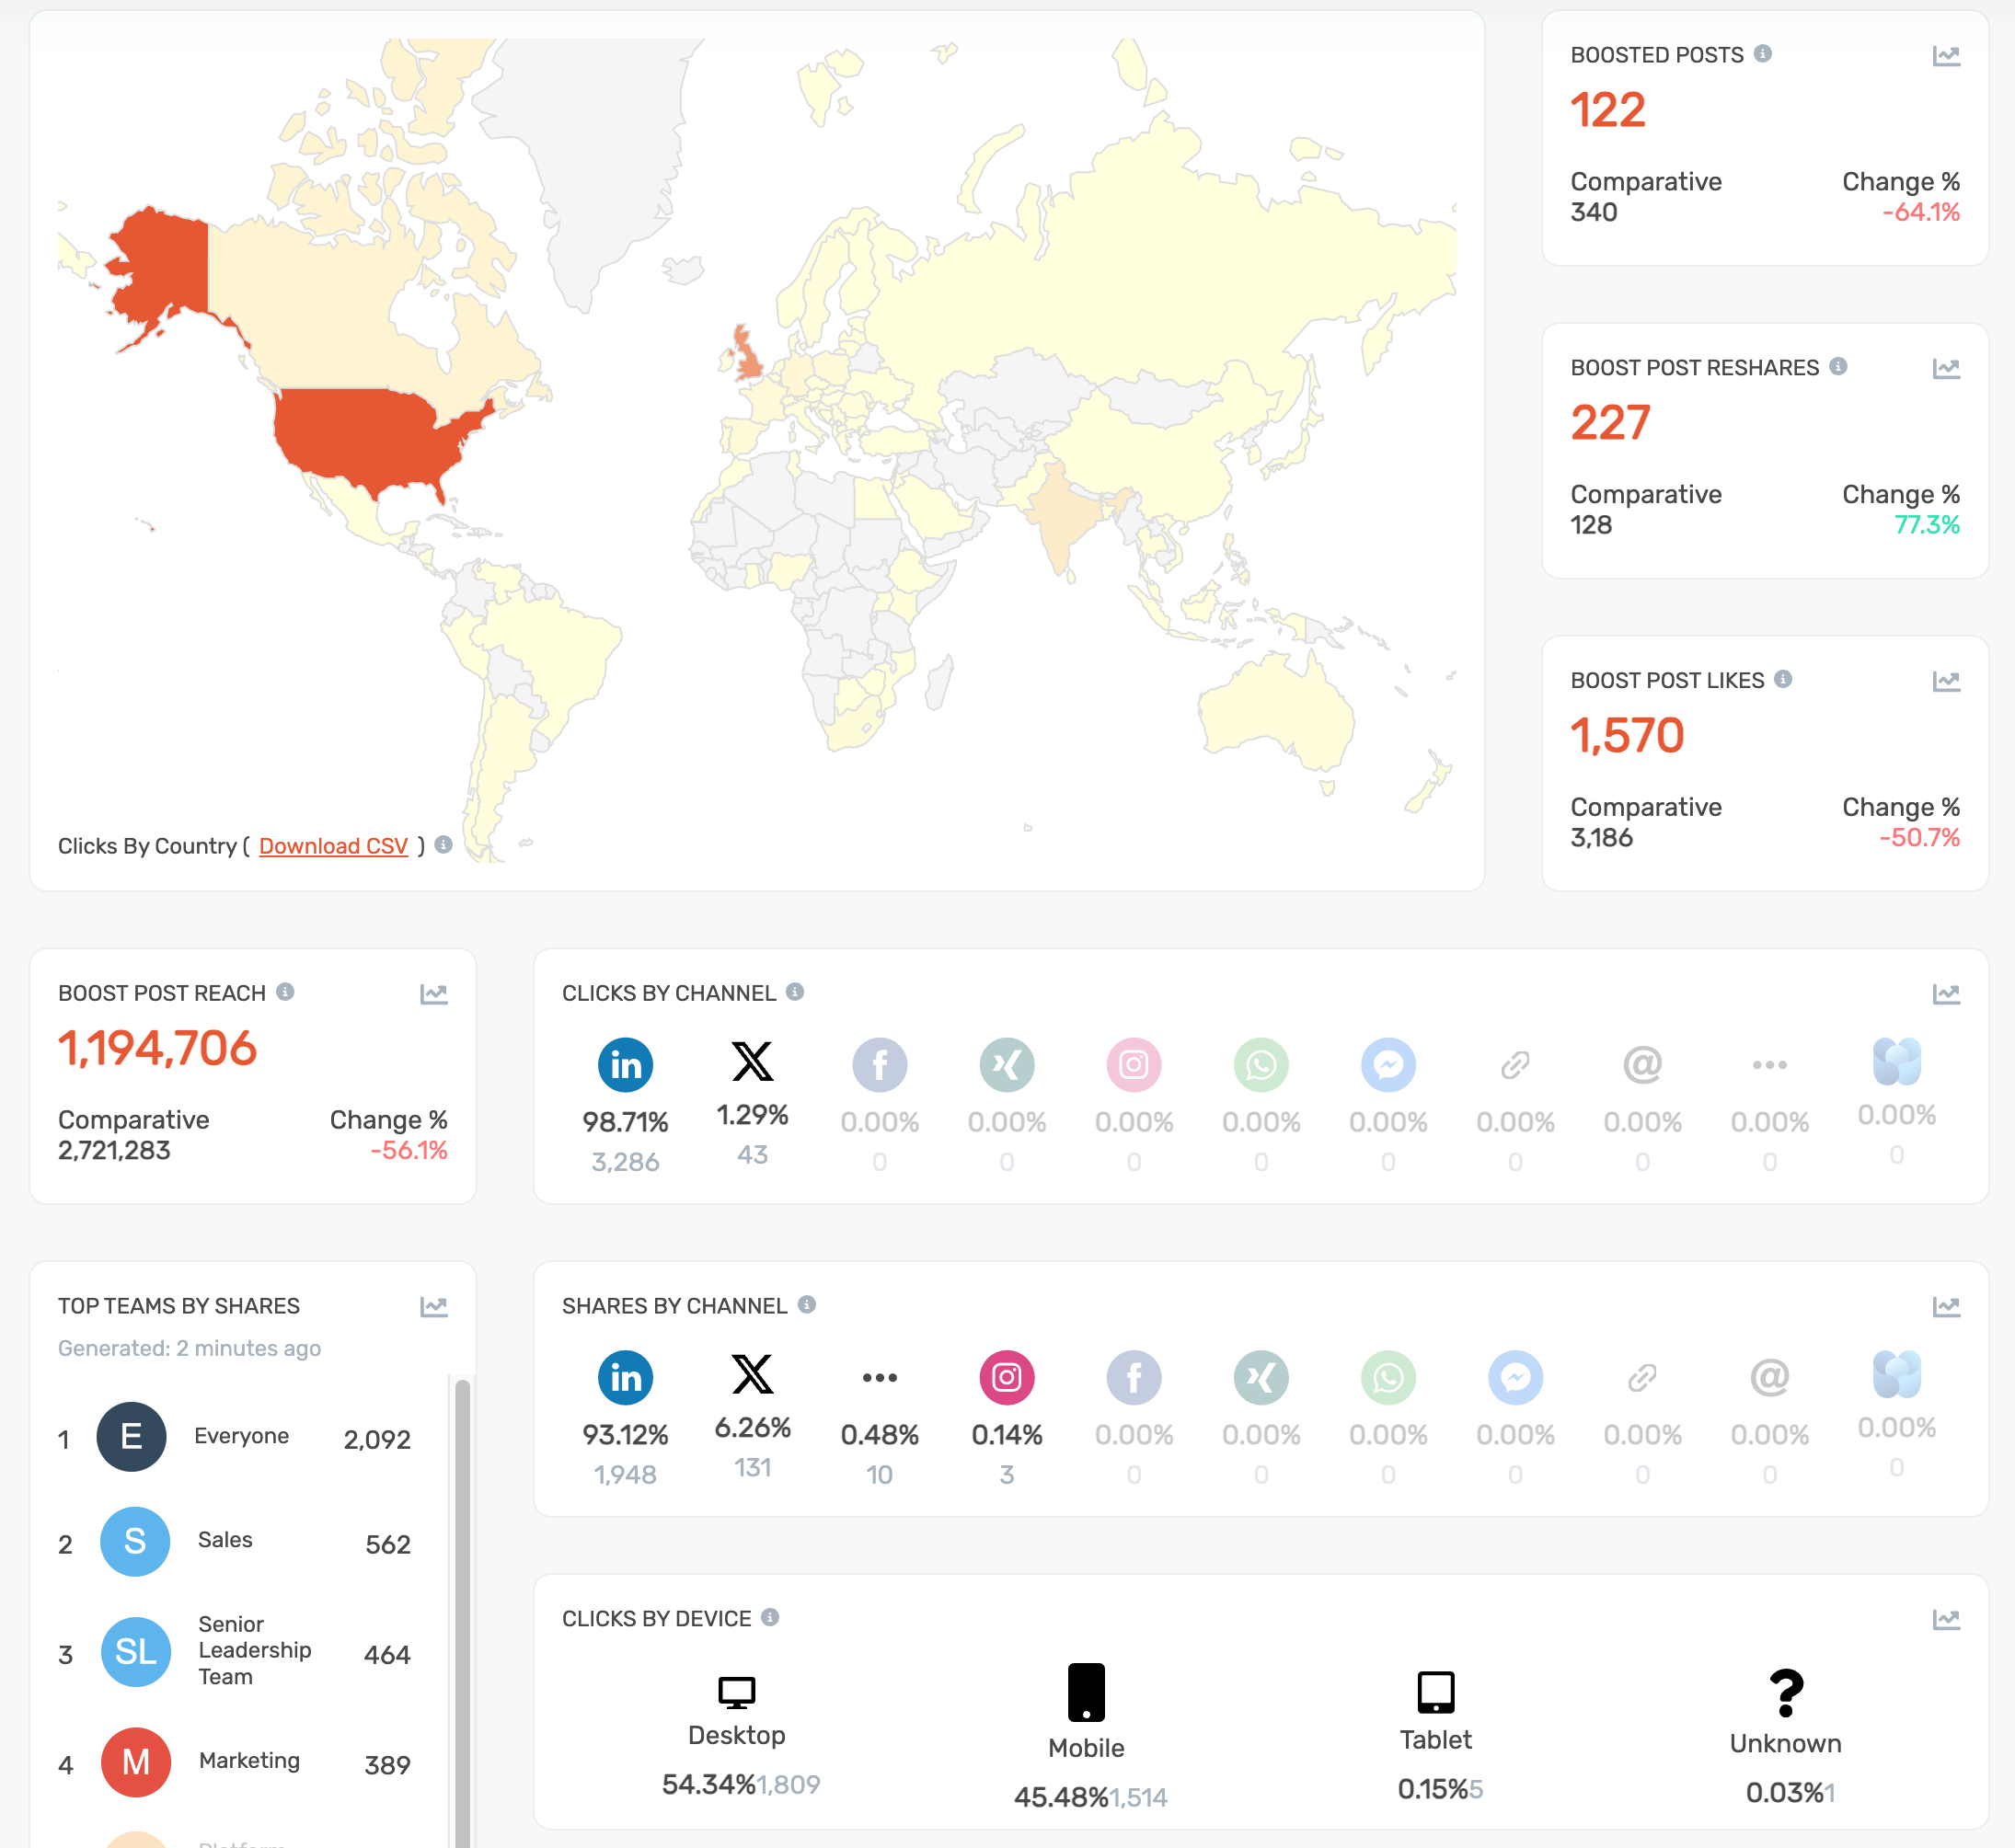
As you scroll down the analytics dashboard, you will find additional stats to get more granular with your reporting.
World Heat Map:
Here you can see a heat map, based on the total number of clicks generated during your chosen time period by country.
Hover over each country to see the number of clicks.
Boost Post Metrics:
These metrics are for those using the Boost Post feature to increase engagement on LinkedIn Company Page and Executive Leader content.
- Boosted Posts (number).
- Boost Post Reshares.
- Boost Post Likes.
- Boost Post Reach.
Social Media Channels:
e.g., LinkedIn, Facebook, X, WhatsApp, Email.
- Clicks by Channel.
- Shares by Channel.
Top Teams by Shares:
Here you will find a leaderboard of the teams you have created in DSMN8, ranked by total shares.
Your teams could be set up regionally (e.g., North America, Europe, Asia) or by department (e.g., sales, marketing, recruitment).
Clicks by Device:
Compare clicks by device used, e.g., desktop vs mobile.
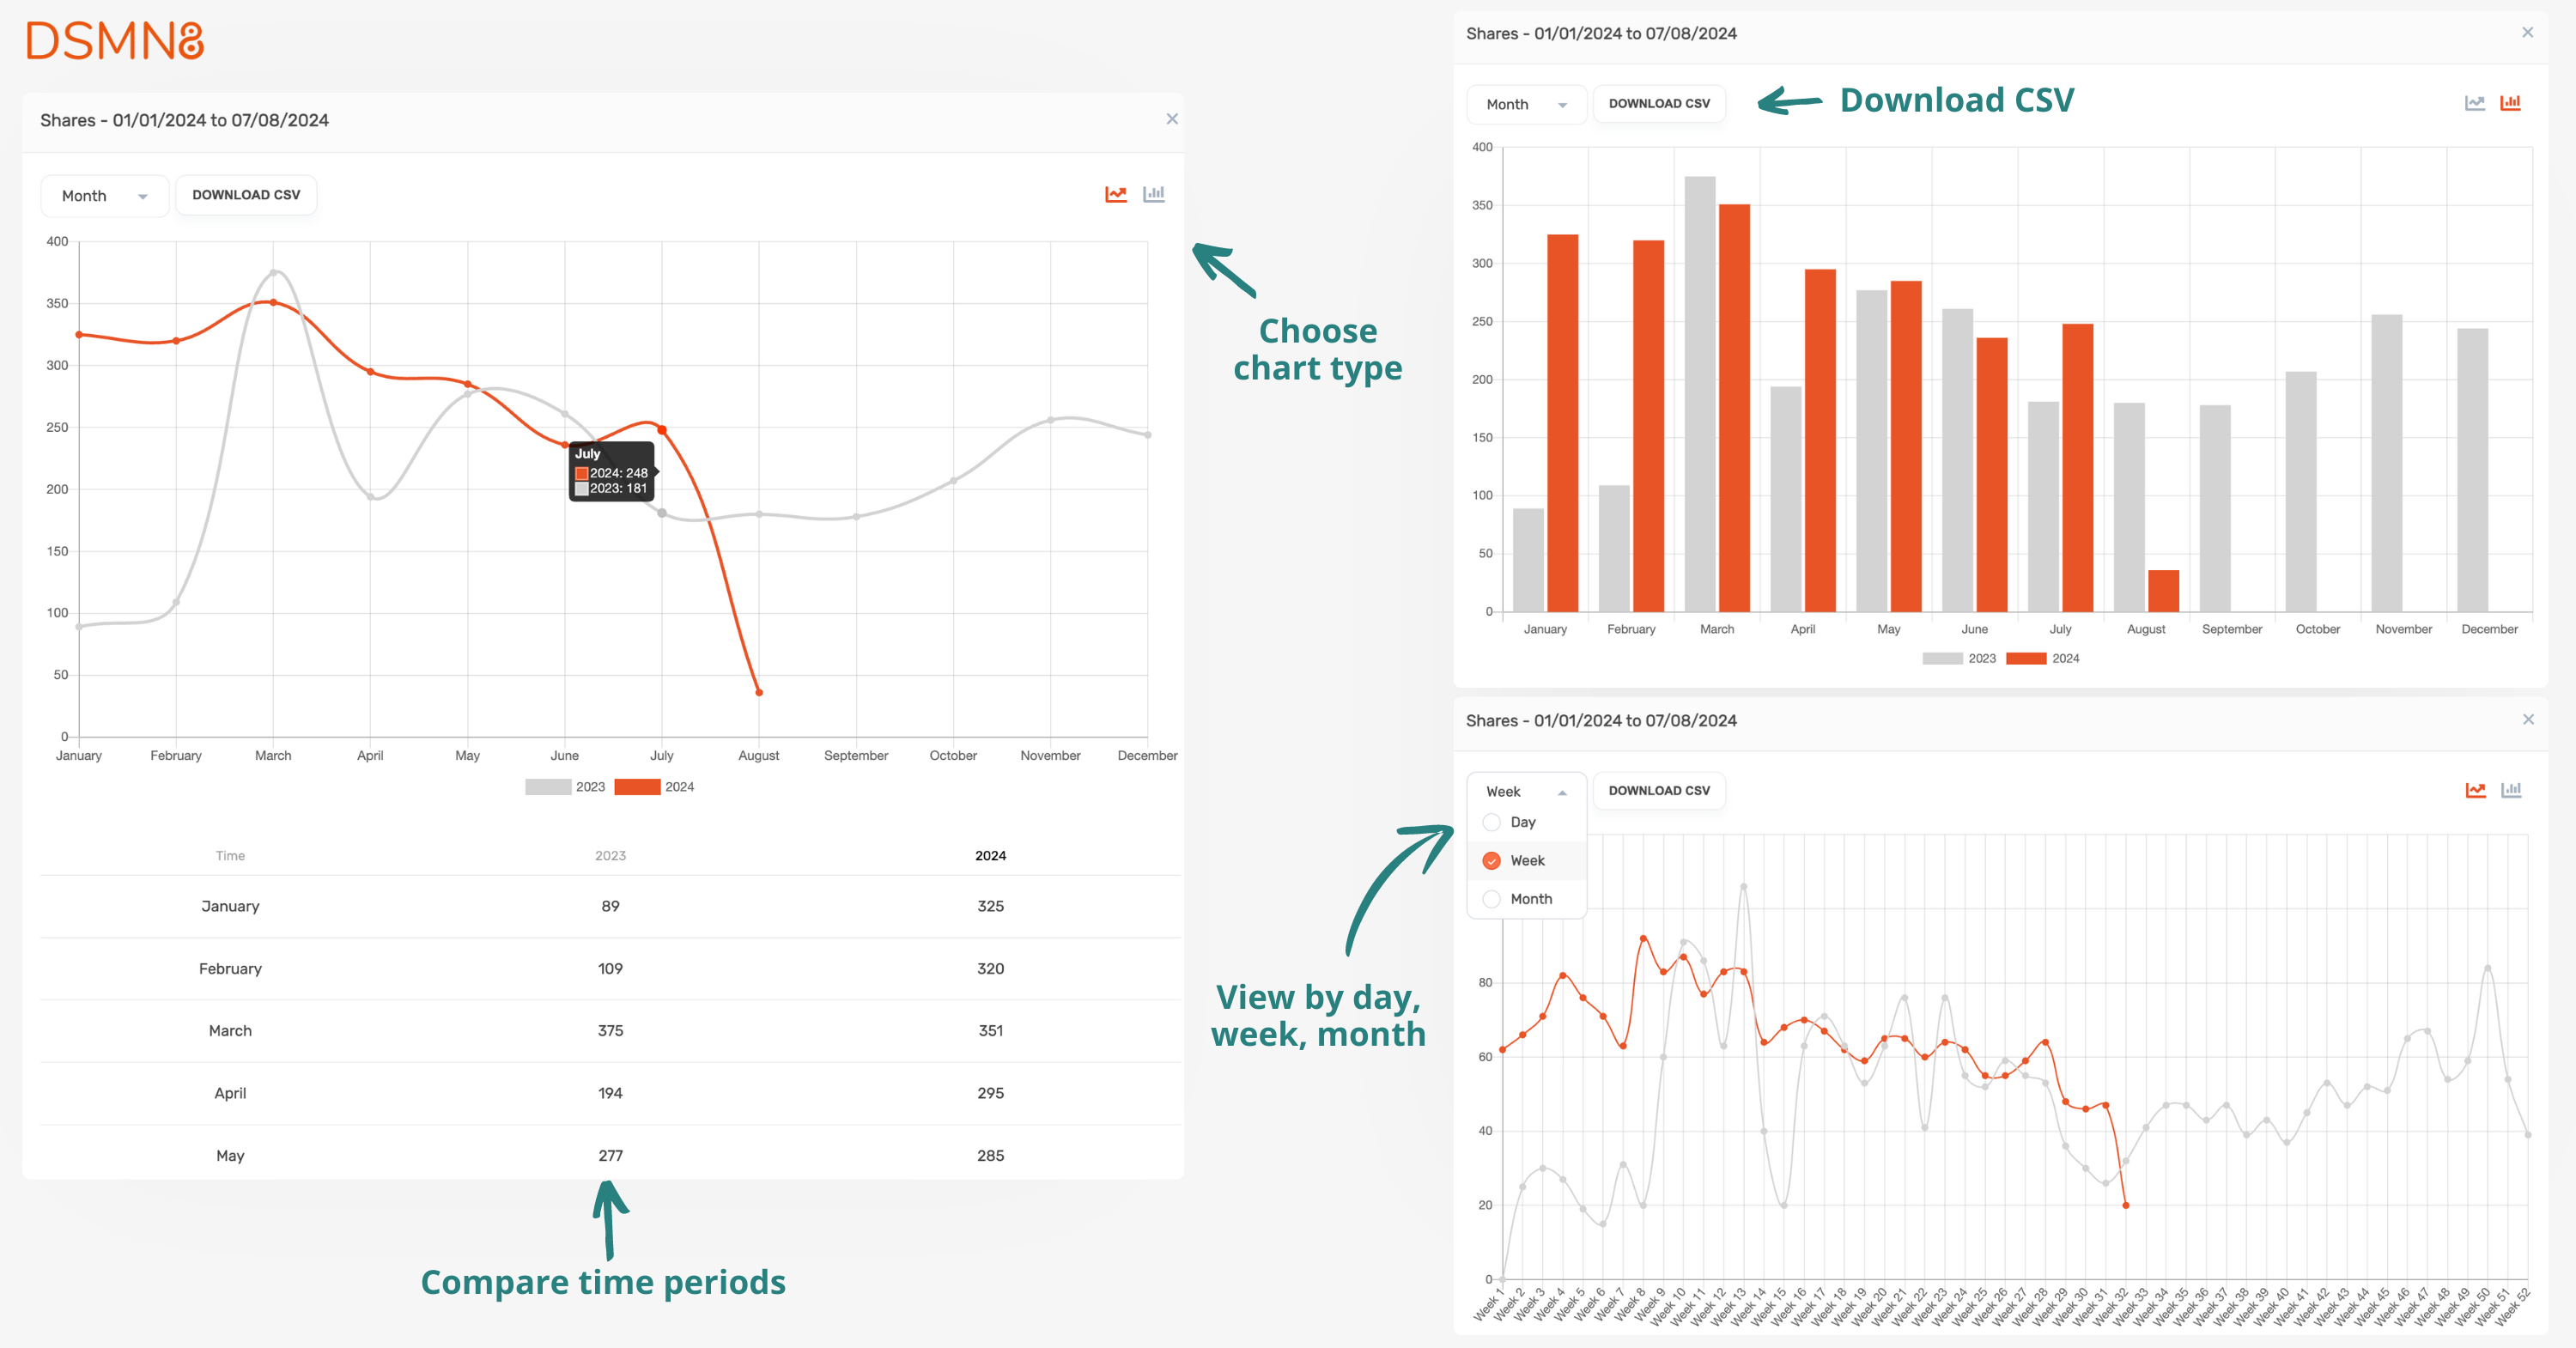
From your analytics dashboard, you can click into each metric to see the data in more detail (pictured above).
These charts can be displayed in different formats, including a graph or bar chart, and the raw numbers are visible underneath as a table.
Adjust views by day, week or month, and compare results from chosen time periods.
You can export all of this data as CSV files to analyze in any way you prefer.
Campaigns, Events & UTMs
I won’t dive into all of the Campaign, Event, and UTM settings here, but it’s worth briefly covering these features as they relate to reporting and analytics.
Campaigns
Campaigns are a way to tag your content for more granular reporting. You could use this to track specific sales or marketing campaigns, or segment content by topic.
In DSMN8, you can set fixed hashtags to your campaigns, which will automatically get added to post captions within the campaign. You can also set dates for time-specific campaigns.
Events
Perhaps you’re looking to segment content from an event you’re hosting.
Doing this within DSMN8 makes it easy for employees to find content to share about your event, and prevents them sharing outdated event promotions after your chosen date.
It also allows you to understand your content performance from specific events in more detail.
UTM & URL Tracking
Finally, URL tracking makes it easy for you to create rules using UTMs for seeing your program results within platforms such as Google Analytics or Marketo.
You can set custom UTM parameters by teams, groups, sources, and even by specific URLs.
Larger organizations with subsidiary brands often use this to segment their program results and align with each organization’s reporting style.
For more information, check out these guides in the DSMN8 Knowledge Base:
Personal User Analytics
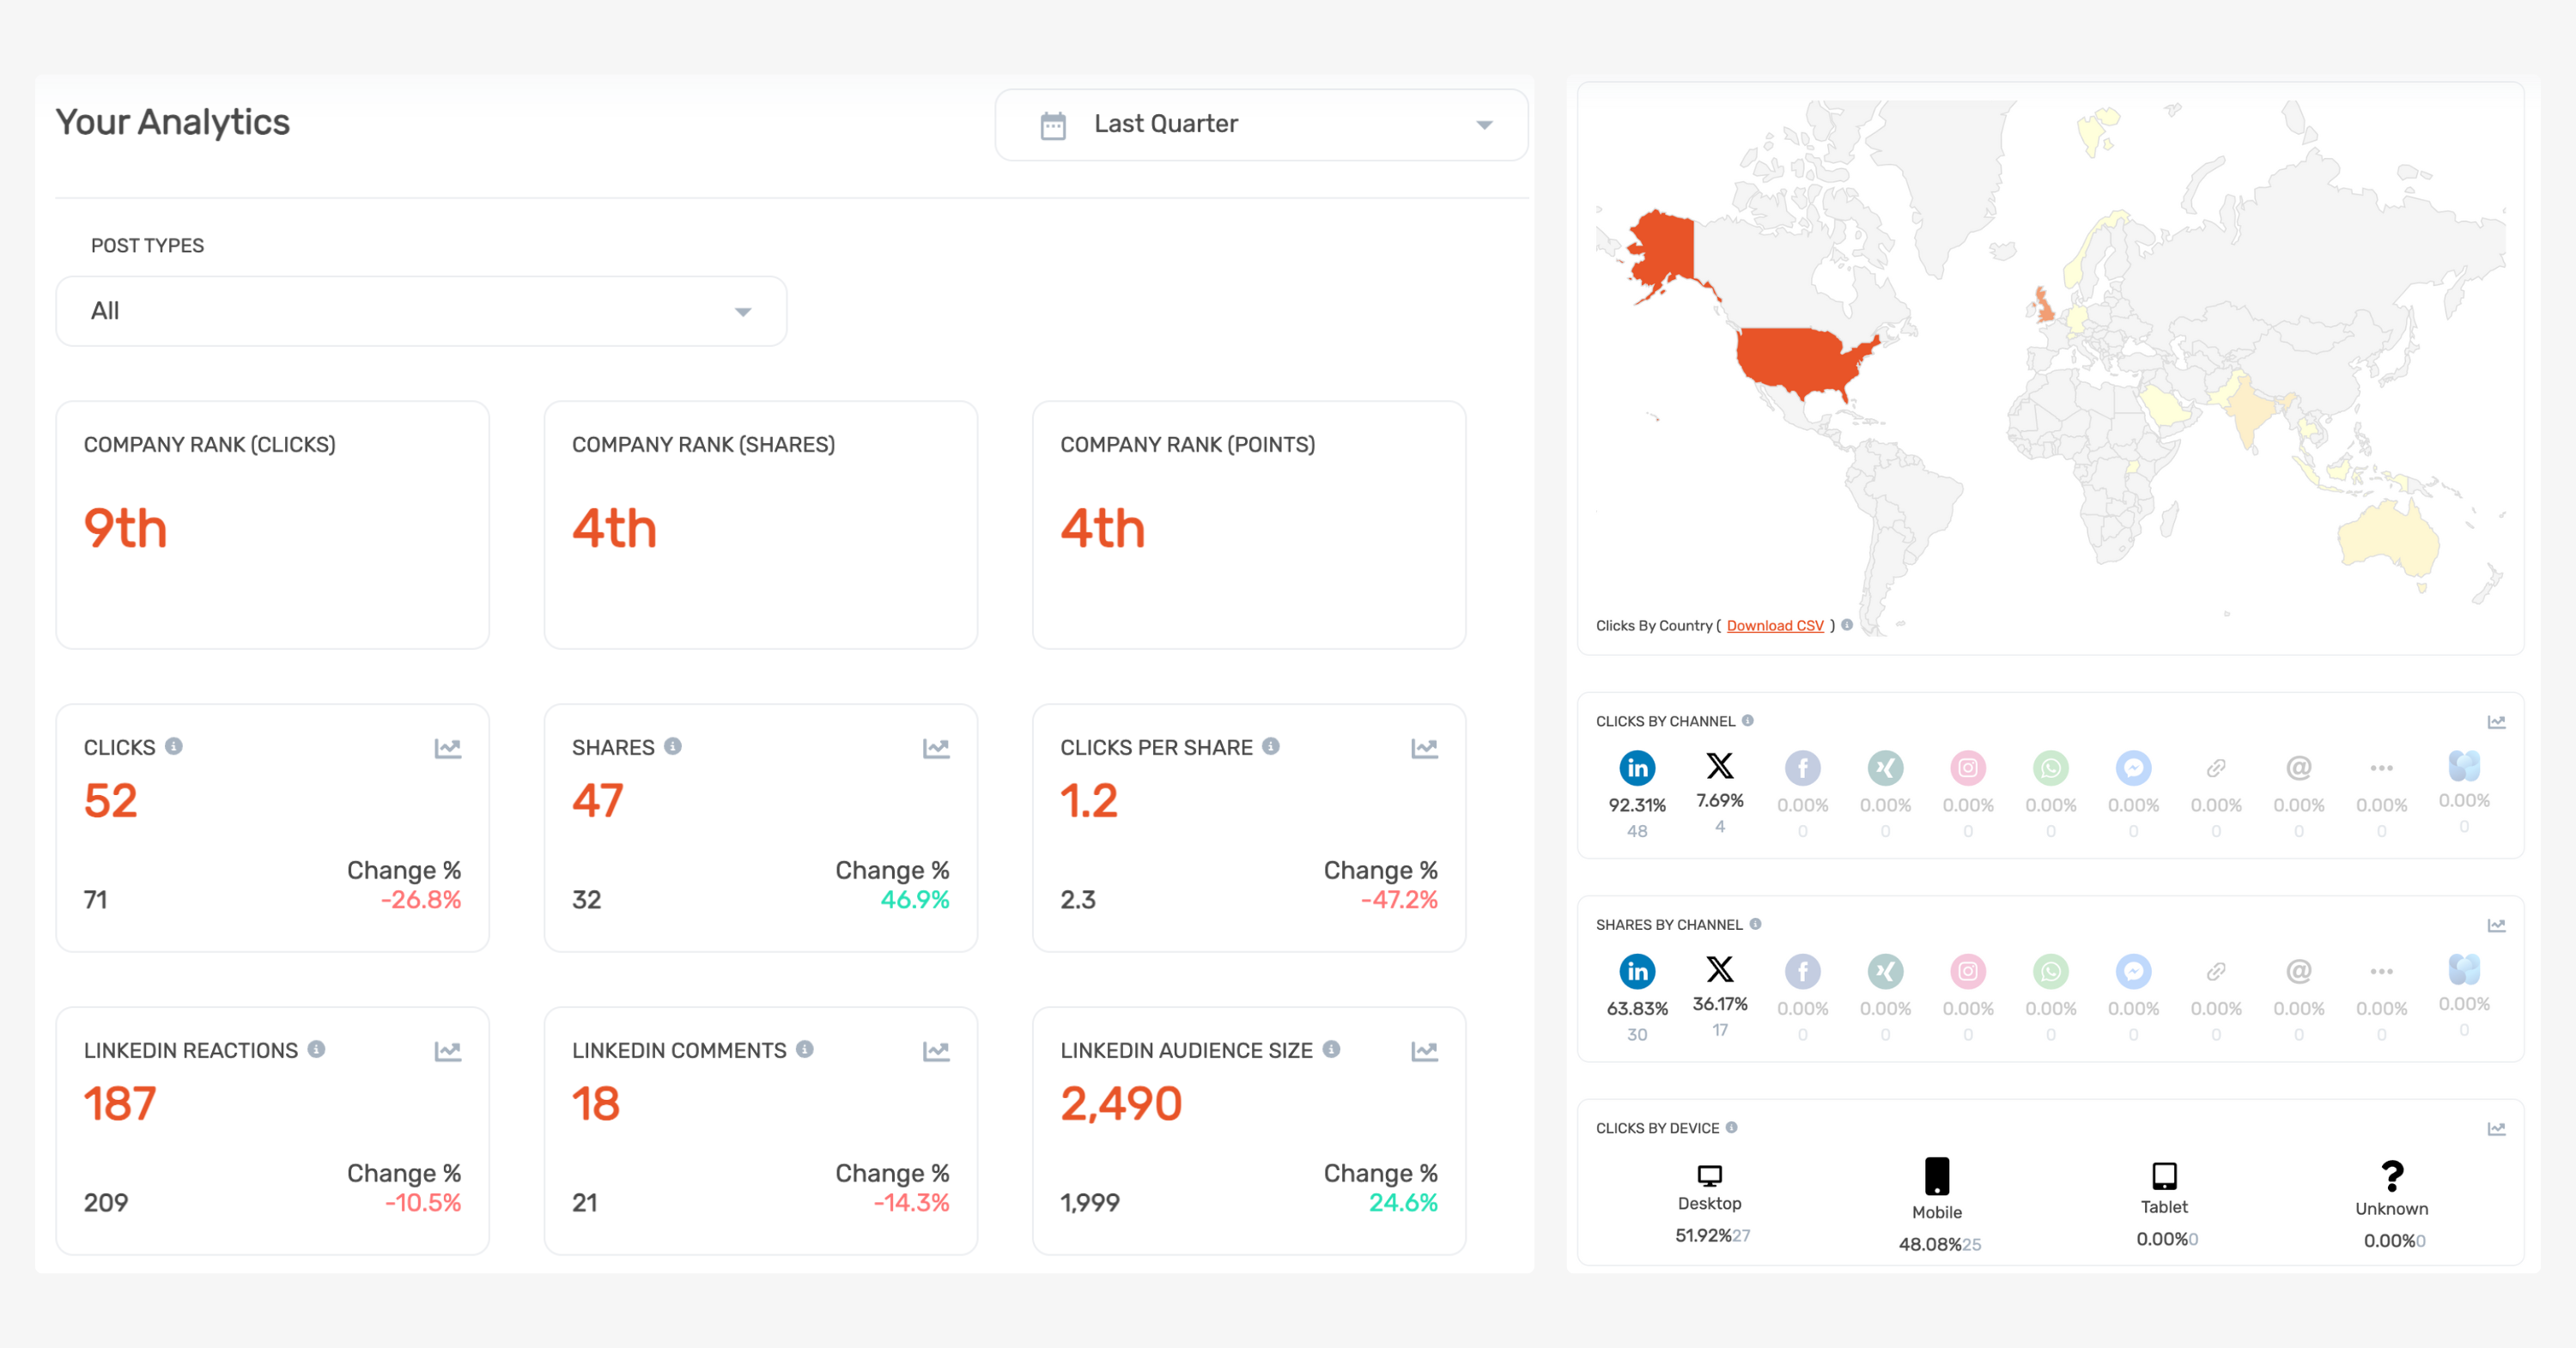
The analytics we’ve covered above are only available for admin users. However, every DSMN8 user will have access to their personal analytics.
This is a great way for your employee advocates to monitor their own progress while building their personal brands and see the impact of their efforts.
As with the overall program analytics dashboard, users can filter their analytics by time period and see the following metrics:
- Clicks.
- Shares.
- Clicks per Share.
- LinkedIn Reactions and Comments.
- LinkedIn Audience Size.
- World Heat Map by Clicks.
- Clicks and Shares by Social Channel.
- Clicks by Device.
- Clicks and Shares (Automated vs Manual).
Users can also see a list of their top performing content by clicks. This helps your employee influencers learn what their audience is most interested in.
On top of this, advocates are able to see where they rank within your company in terms of clicks, shares, and points. Alongside any leaderboards you may be running, this is a way to encourage participation through healthy competition!
Employee Advocacy Newsletter Analytics
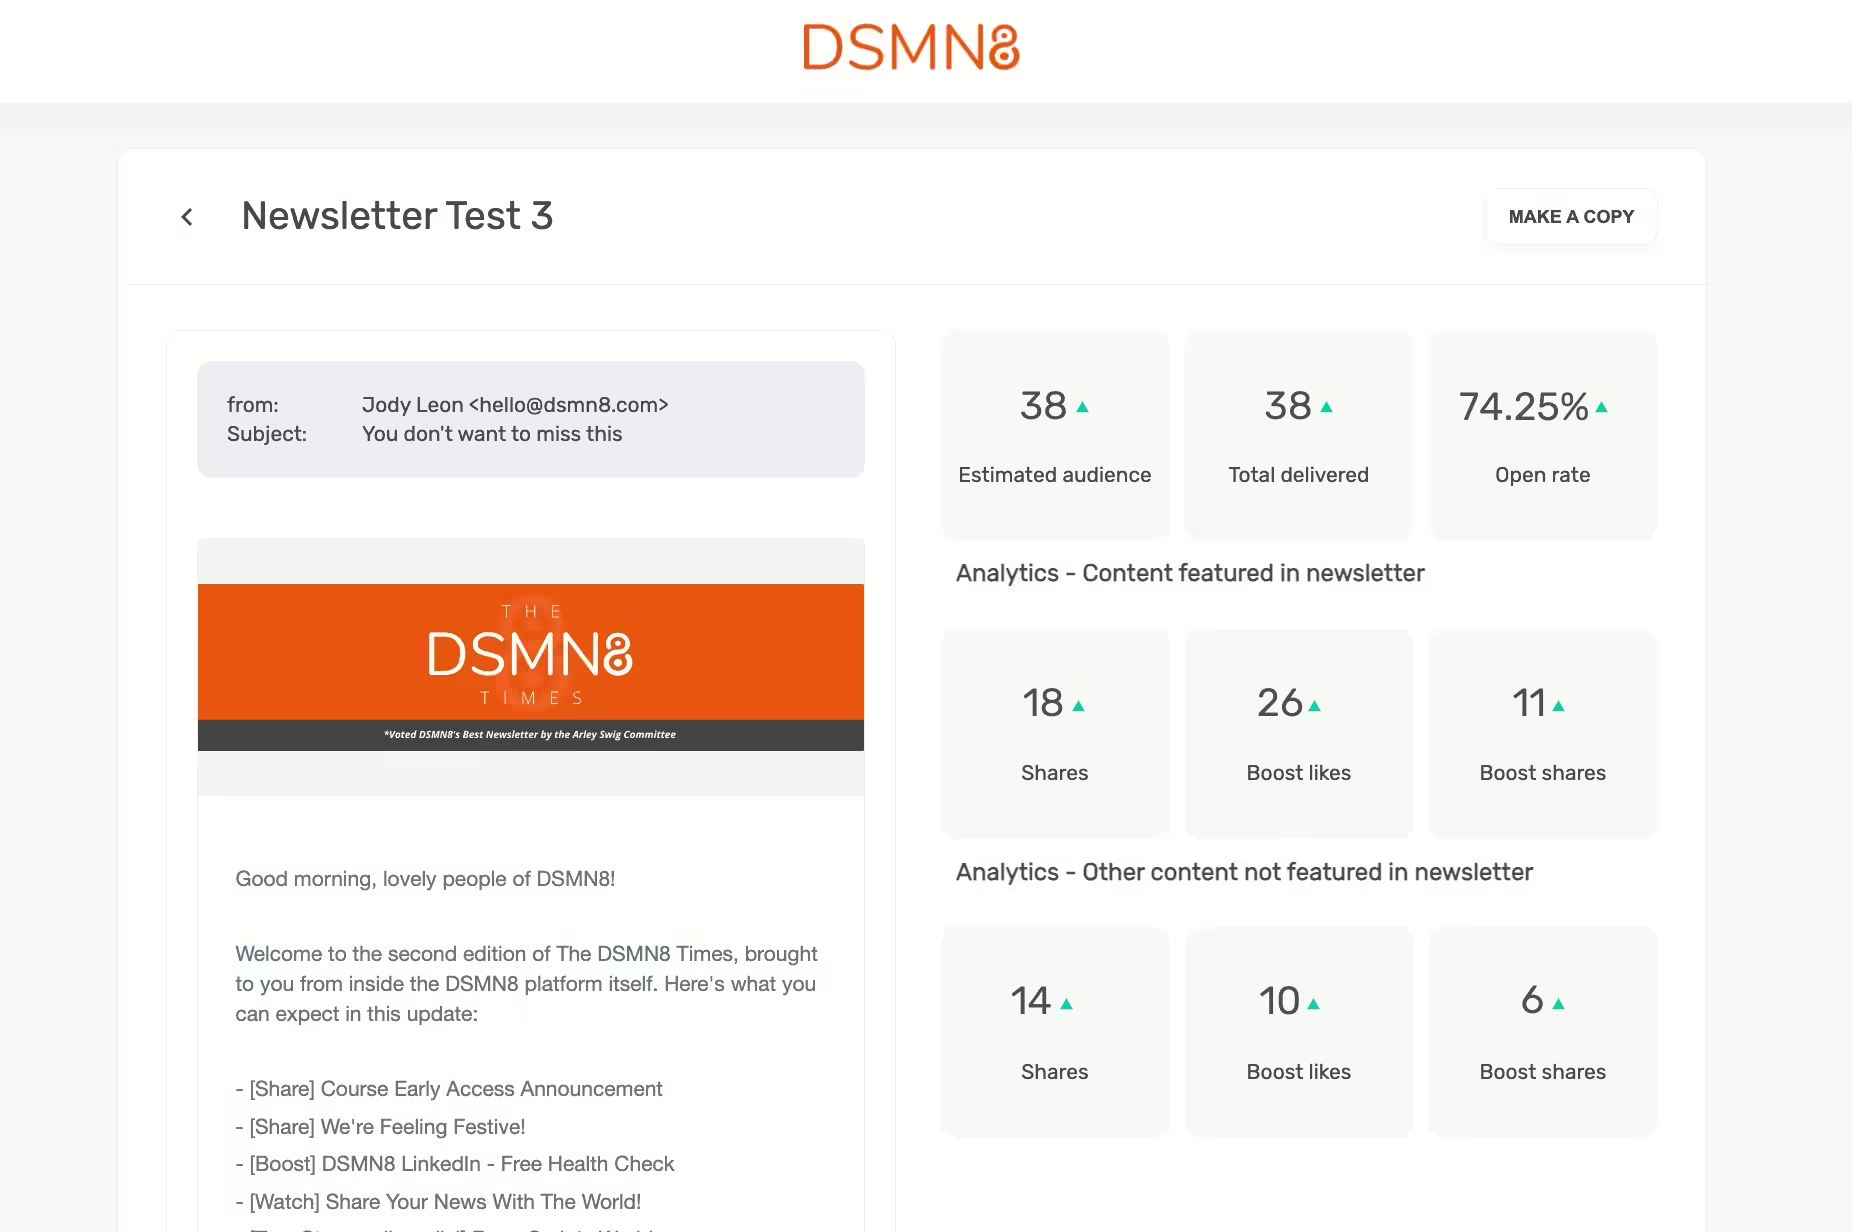
If you’re using DSMN8’s Newsletter Feature, you will find newsletter analytics within the platform.
Admins can see the usual email newsletter metrics you’d expect, including:
- Estimated audience.
- Total emails delivered.
- Open rate percentage.
When you add DSMN8 posts to your employee advocacy newsletters, you’ll also find additional data from the content featured. This includes:
- Shares.
- Boost post likes.
- Boost post shares.
This reveals which content is resonating with your team, and the impact your newsletters are having on your employee advocacy program results.
Admins can also see the same metrics for content that isn’t included in the newsletter itself.
This tracks the shares and likes from additional content in the DSMN8 platform when an employee clicks through from your newsletter.
5 Ways to Use Employee Advocacy Reports for Content Ideas
We’ve covered the ins and outs of the DSMN8 employee advocacy analytics suite, the key metrics for effective reporting, and the insights available for employee advocacy newsletters.
But there’s no use tracking the data if you’re not using it to inform your content strategy!
Here are five ways to use employee advocacy program reports to generate content ideas:
Employee Advocacy Benchmarks
One of the biggest questions program managers ask is: How do our advocacy metrics stack up against industry standards?
Tracking your own performance is essential, but understanding how your numbers compare to others in your industry provides valuable context. That’s where benchmarking comes in.
Rather than guessing, you can now access real-world industry data in DSMN8’s Employee Advocacy Benchmark Report. It’ll help you:
📊 Compare your metrics to averages.
🚀 Identify areas where you’re outperforming (or falling behind).
📈 Set realistic goals and key objectives for 2026 and beyond.
Of course, your results will vary depending on many elements, such as company size, industry, and program maturity. However, the report provides helpful key learnings and insights from 200 organizations.
Want to get more specific and see how you stack up against your direct competitors? Get a free employee advocacy health check.
Additional Resources
Visit the DSMN8 Knowledge Base for more information about the Analytics Suite.
To learn more about employee advocacy reporting, analytics, and metrics, check out the guides below 👇
Ready to get started with the #1 employee advocacy platform?
Wondering how active your team already is, and how this compares with your competitors?
Emily Neal
SEO and Content Specialist at DSMN8. Emily has 10 years experience blogging, and is a pro at Pinterest Marketing, reaching 1 million monthly views. She’s all about empowering employees to grow their personal brands and become influencers.

