DSMN8’s data team are busy bees. They regularly create employee advocacy reports and rank organizations based on their social media activity. You might have seen them on LinkedIn!
These reports reveal the organizations with the most active employees on social media.
Each one focuses on a different sector, and in total, they’ve analyzed the employee social presence in over 90 industries.
It’s fascinating stuff 👀
So, I was very excited to get my hands on a compilation of the most recent reports from each industry to understand the global impact across all sectors.
I wanted to know:
- Which industries have the most active employee advocates?
- Which countries have the highest amount of employees sharing content?
- Does company size play a role? Are those in smaller organizations more likely to support building a brand presence on social media?
- Which industry is the least active?
- What’s the overall average percentage of active employees globally across all sectors?
Today, I’ve got the answers for you.
Let’s dive into the data! 👇
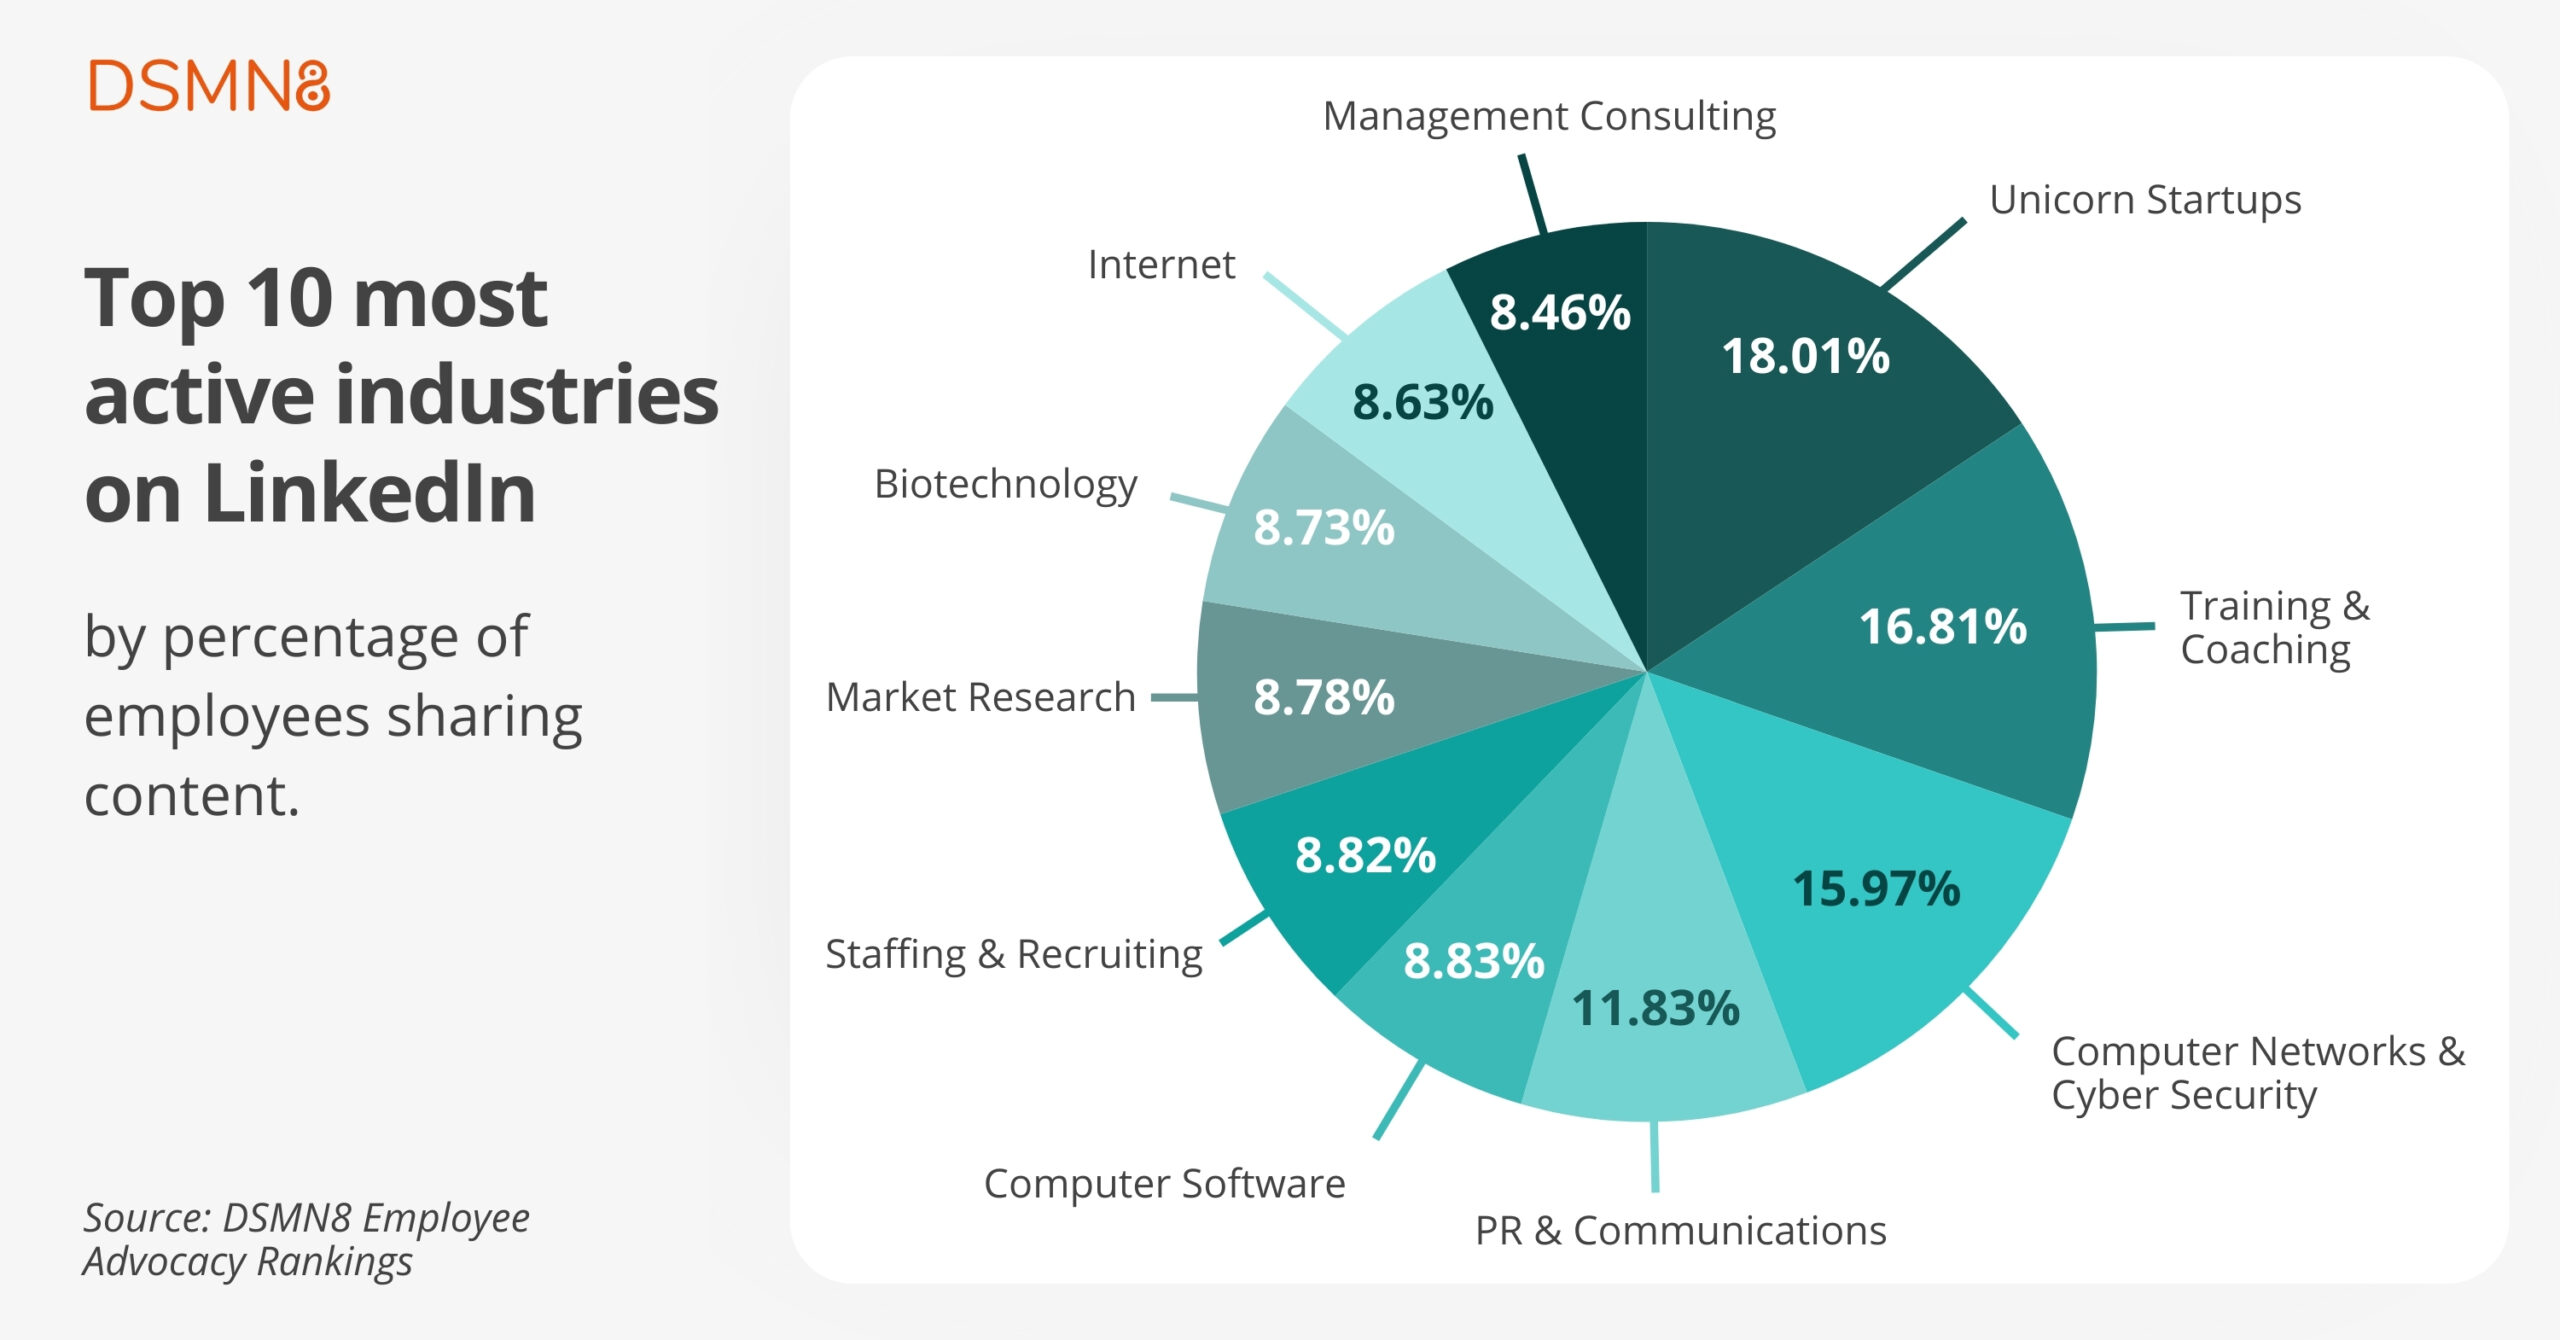
The most active industries on LinkedIn, by % of employees sharing content.
When looking at which industries have the most active employees on social media, one sector stands above the rest:
Unicorn startups–privately owned startups valued at over $1 billion.
We actually wrote a report about unicorns a few years ago, contemplating the possibility of a link between stock price and social media presence.
While we can’t say for sure that the two are connected, what we can say is that employees at unicorns are particularly invested in building brand awareness on social media. Organizations in other industries can learn from this positive approach.
The remaining industries in the top 10 are all sectors that would benefit from running employee advocacy programs 👇
- B2B industries that lean heavily on interpersonal relationships, e.g. Training & Coaching and Management Consulting.
- Technology sectors like Internet, Computer Networks & Cyber Security and Computer Software.
- Industries that benefit directly from or rely on LinkedIn, including Staffing & Recruiting and PR & Communications.
| Industry | Avg. % of Employees Sharing Content |
|---|---|
| Unicorn Startups | 18.01% |
| Training & Coaching | 16.81% |
| Computer Networks & Cyber Security | 15.97% |
| PR & Communications | 11.83% |
| Computer Software | 8.83% |
| Staffing & Recruiting | 8.82% |
| Market Research | 8.78% |
| Biotechnology | 8.73% |
| Internet | 8.63% |
| Management Consulting | 8.46% |
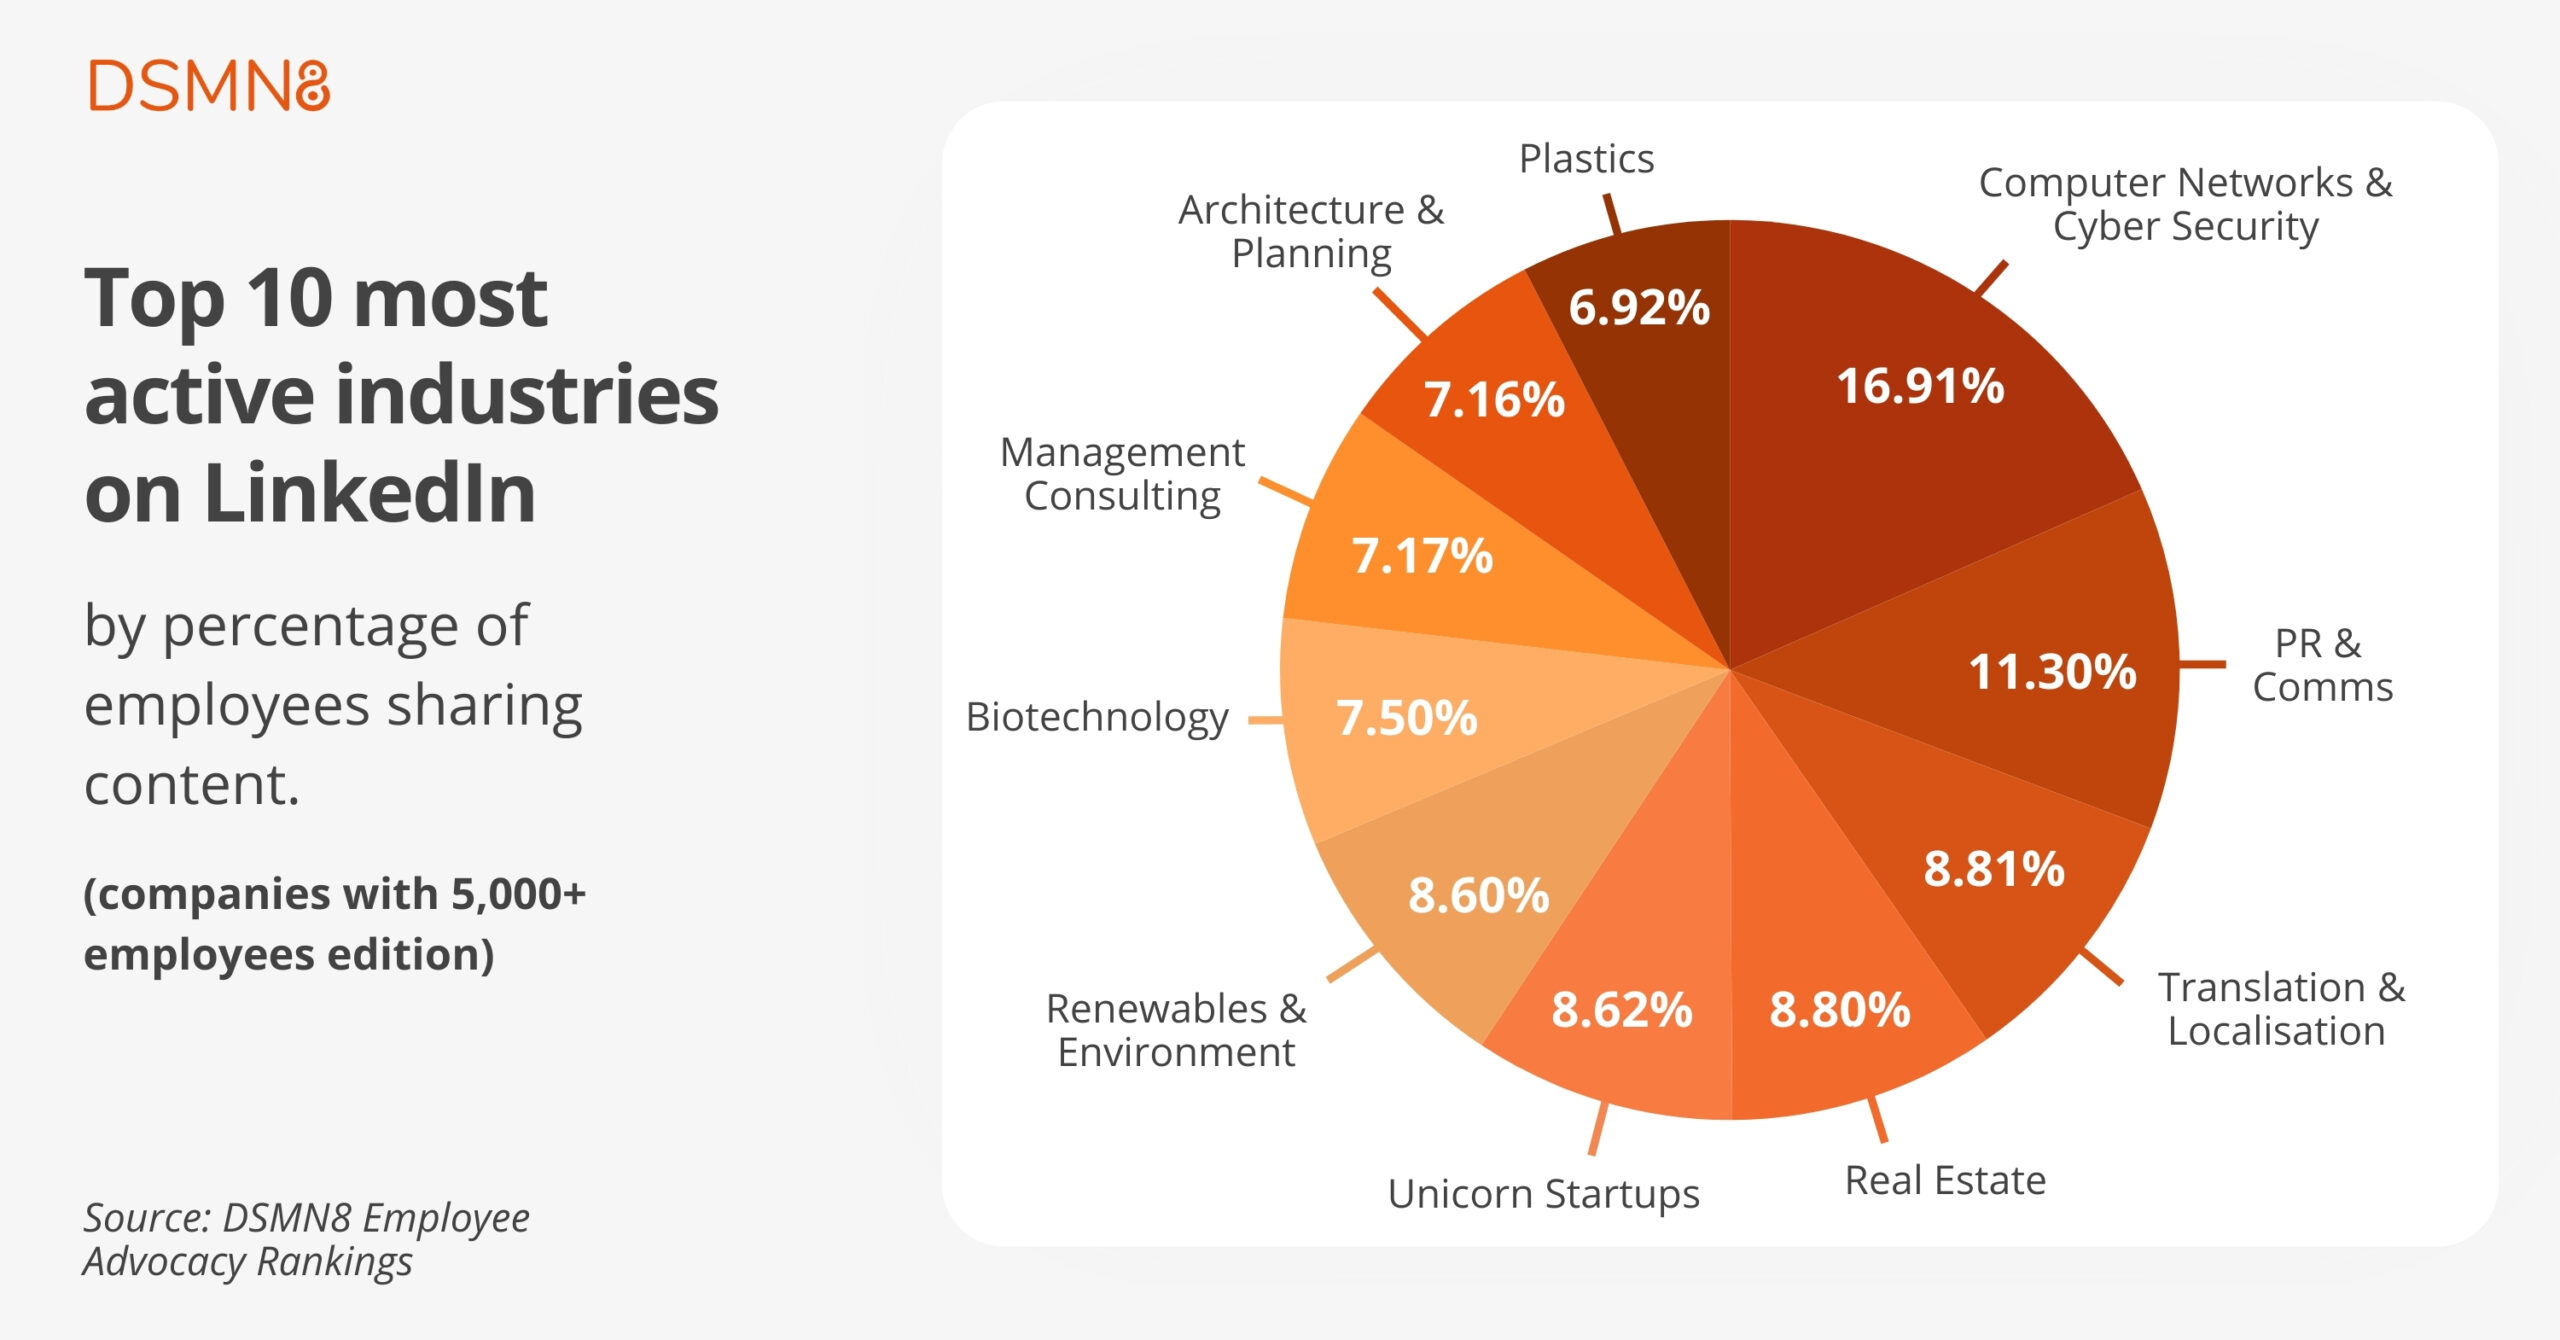
I was interested to see if the top 10 industries would change depending on company size, and they did, but not drastically.
When looking at organizations with over 5,000 employees, these sectors remained in the top 10:
- Computer Networks & Cyber Security
- Management Consulting
- PR & Communications
- Biotechnology
- Unicorn Startups
| Industry | Avg. % of Employees Sharing Content |
|---|---|
| Computer Networks & Cyber Security | 16.91% |
| PR & Communications | 11.30% |
| Translation & Localization | 8.81% |
| Real Estate | 8.80% |
| Unicorn Startups | 8.62% |
| Renewables & Environment | 8.60% |
| Biotechnology | 7.50% |
| Management Consulting | 7.17% |
| Architecture & Planning | 7.16% |
| Plastics | 6.92% |
The least active industry on LinkedIn
Interestingly, Food and Beverages was the least active industry on LinkedIn in terms of employee activity.
Only 2.46% of employees in Food and Beverages organizations (on average) share content.
It’s quite a big difference compared to the highest sector, Unicorns, at 18.07% 🦄
Even when excluding unicorns for being, well… unicorns, the next highest sector, Training & Coaching, had an average of 16.81%.
You might have suspected (as I did) that the least active industry would be a heavily regulated sector, such as Pharmaceuticals.
But the more I thought about it, the more it made sense.
The Food and Beverages industry has a very high proportion of employees in blue-collar roles. These employees are busy working away from desks and, therefore, have less time and opportunity to share content on LinkedIn.
The key takeaway here:
If you’re looking to increase employee advocacy in industries like Food and Beverages, Retail or Construction, consider the fact that a large number of your employees will not be desk-based and probably won’t have a work computer.
To get these workers on board, you’ll need technology that works for them, such as DSMN8‘s mobile app with features like Auto-Scheduling to help them stay active.
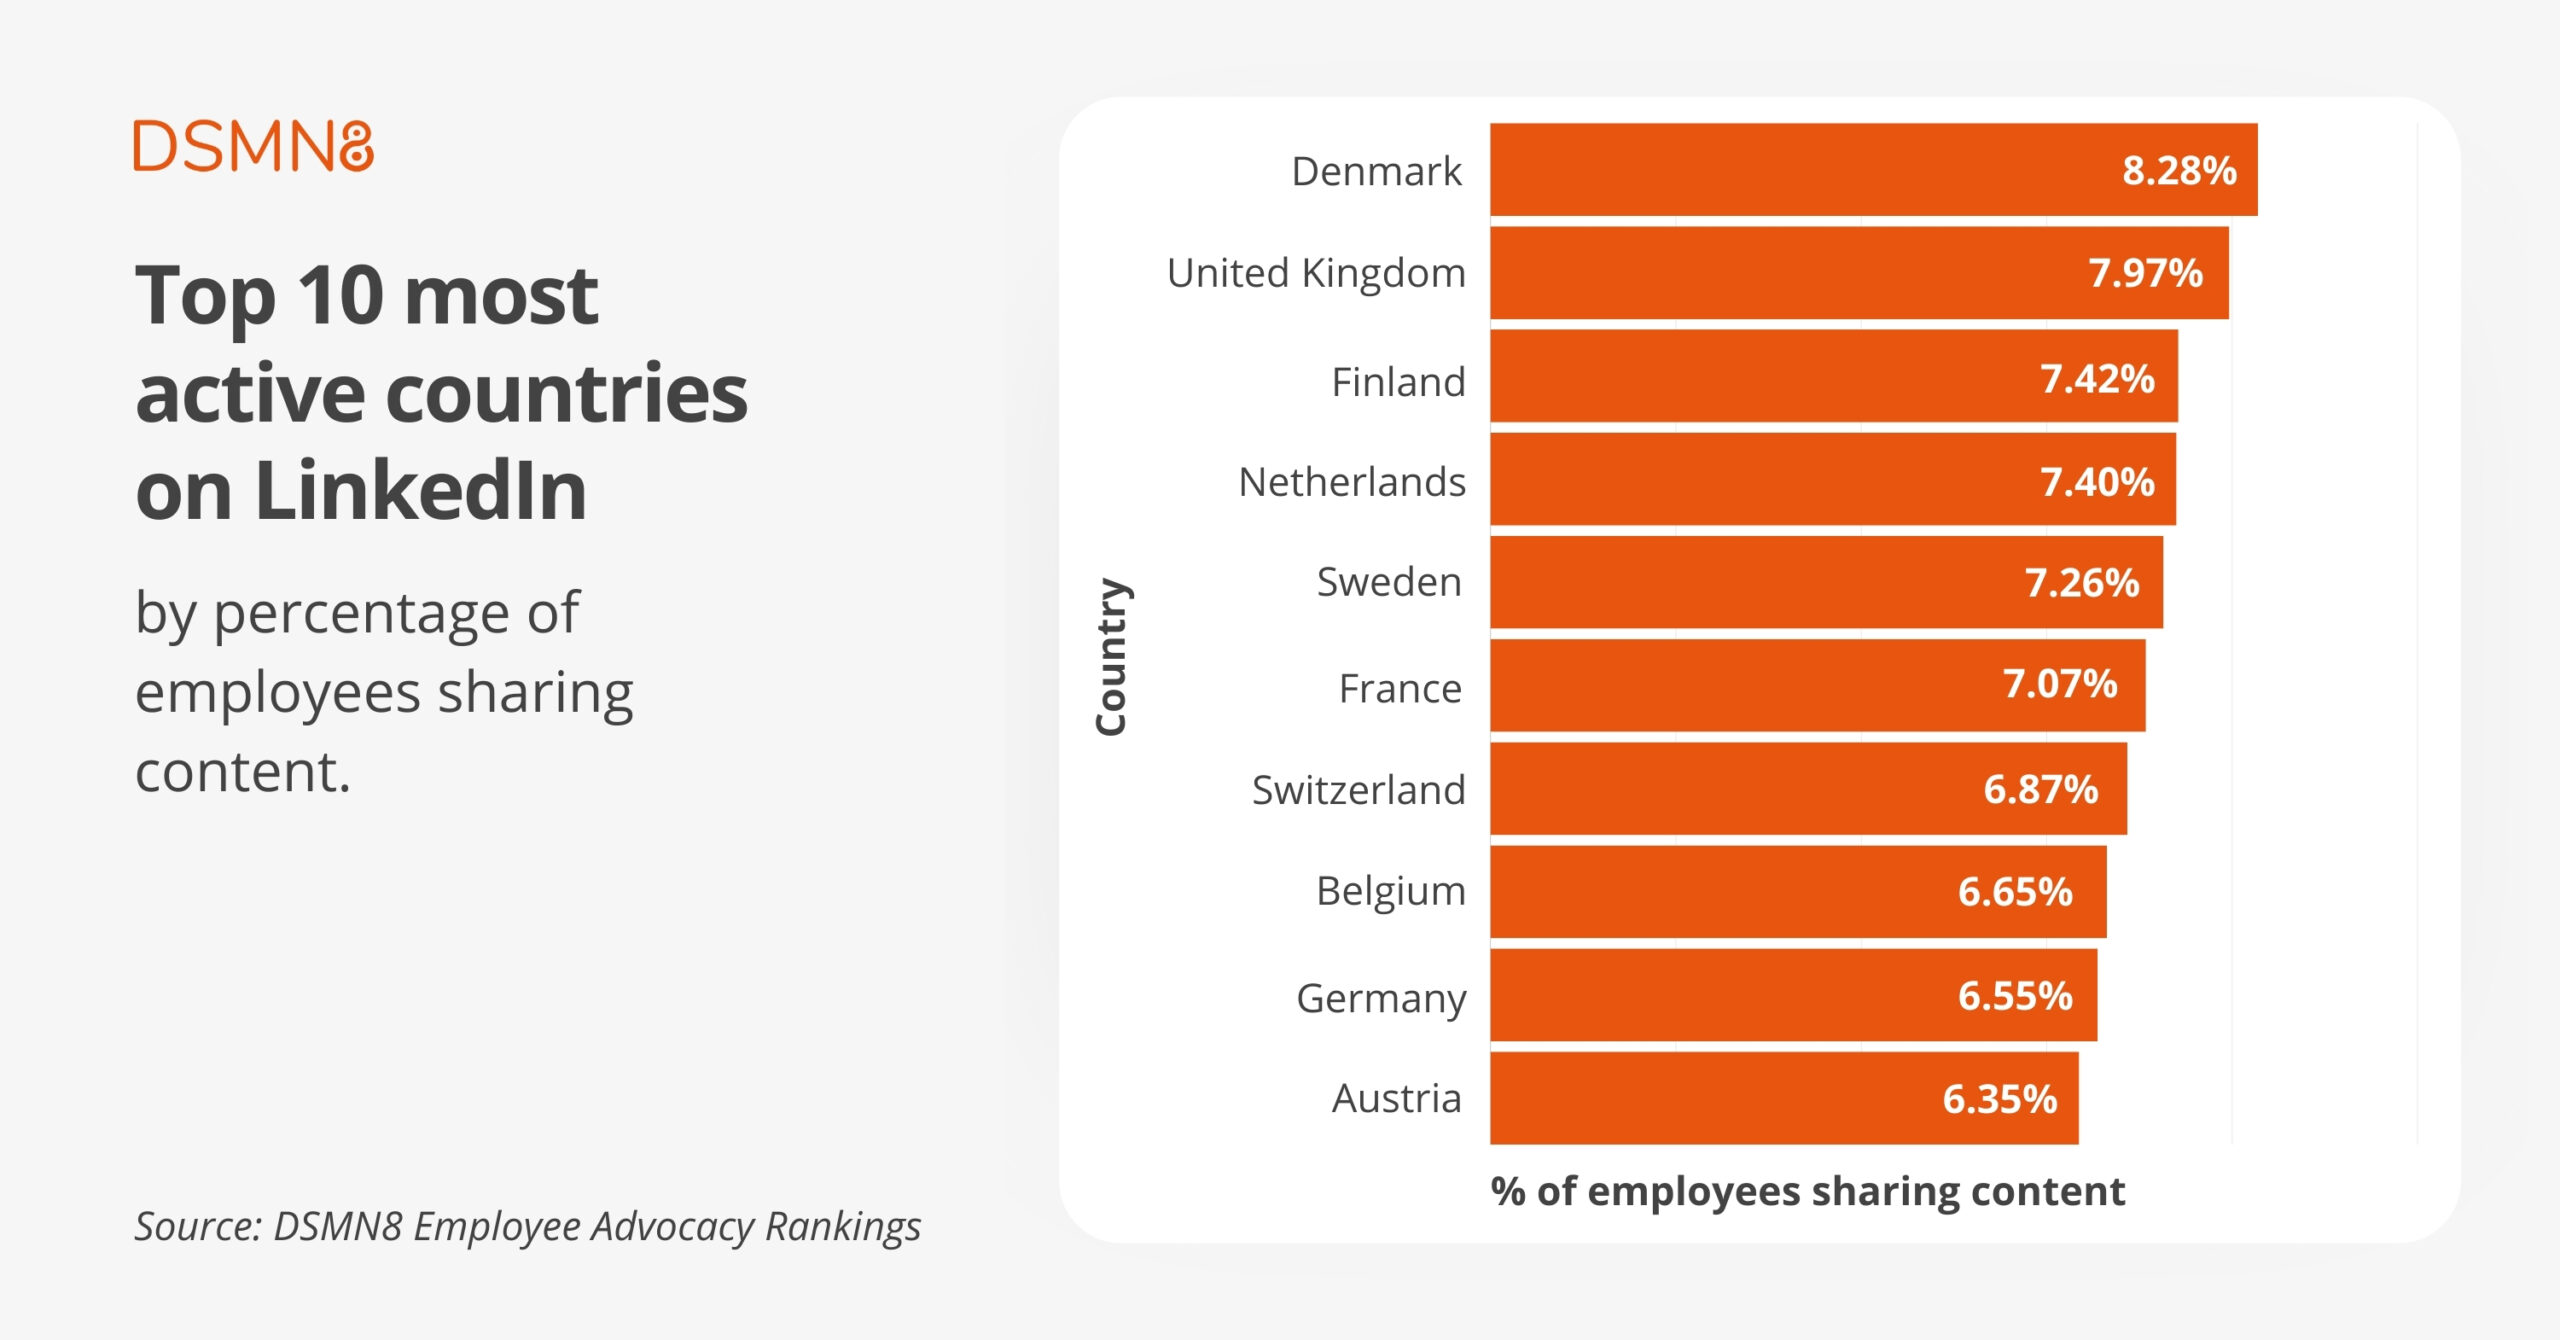
The most active countries on LinkedIn, by % of employees sharing content.
The most active country on LinkedIn, based on the percentage of employees sharing content, is Denmark.
In fact, all of the top 10 are European countries, with the United States at position 11 with an average of 6.29%.
| Country | Avg. % of Employees Sharing Content |
|---|---|
| Denmark | 8.28% |
| United Kingdom | 7.97% |
| Finland | 7.42% |
| Netherlands | 7.40% |
| Sweden | 7.26% |
| France | 7.07% |
| Switzerland | 6.87% |
| Belgium | 6.65% |
| Germany | 6.55% |
| Austria | 6.35% |
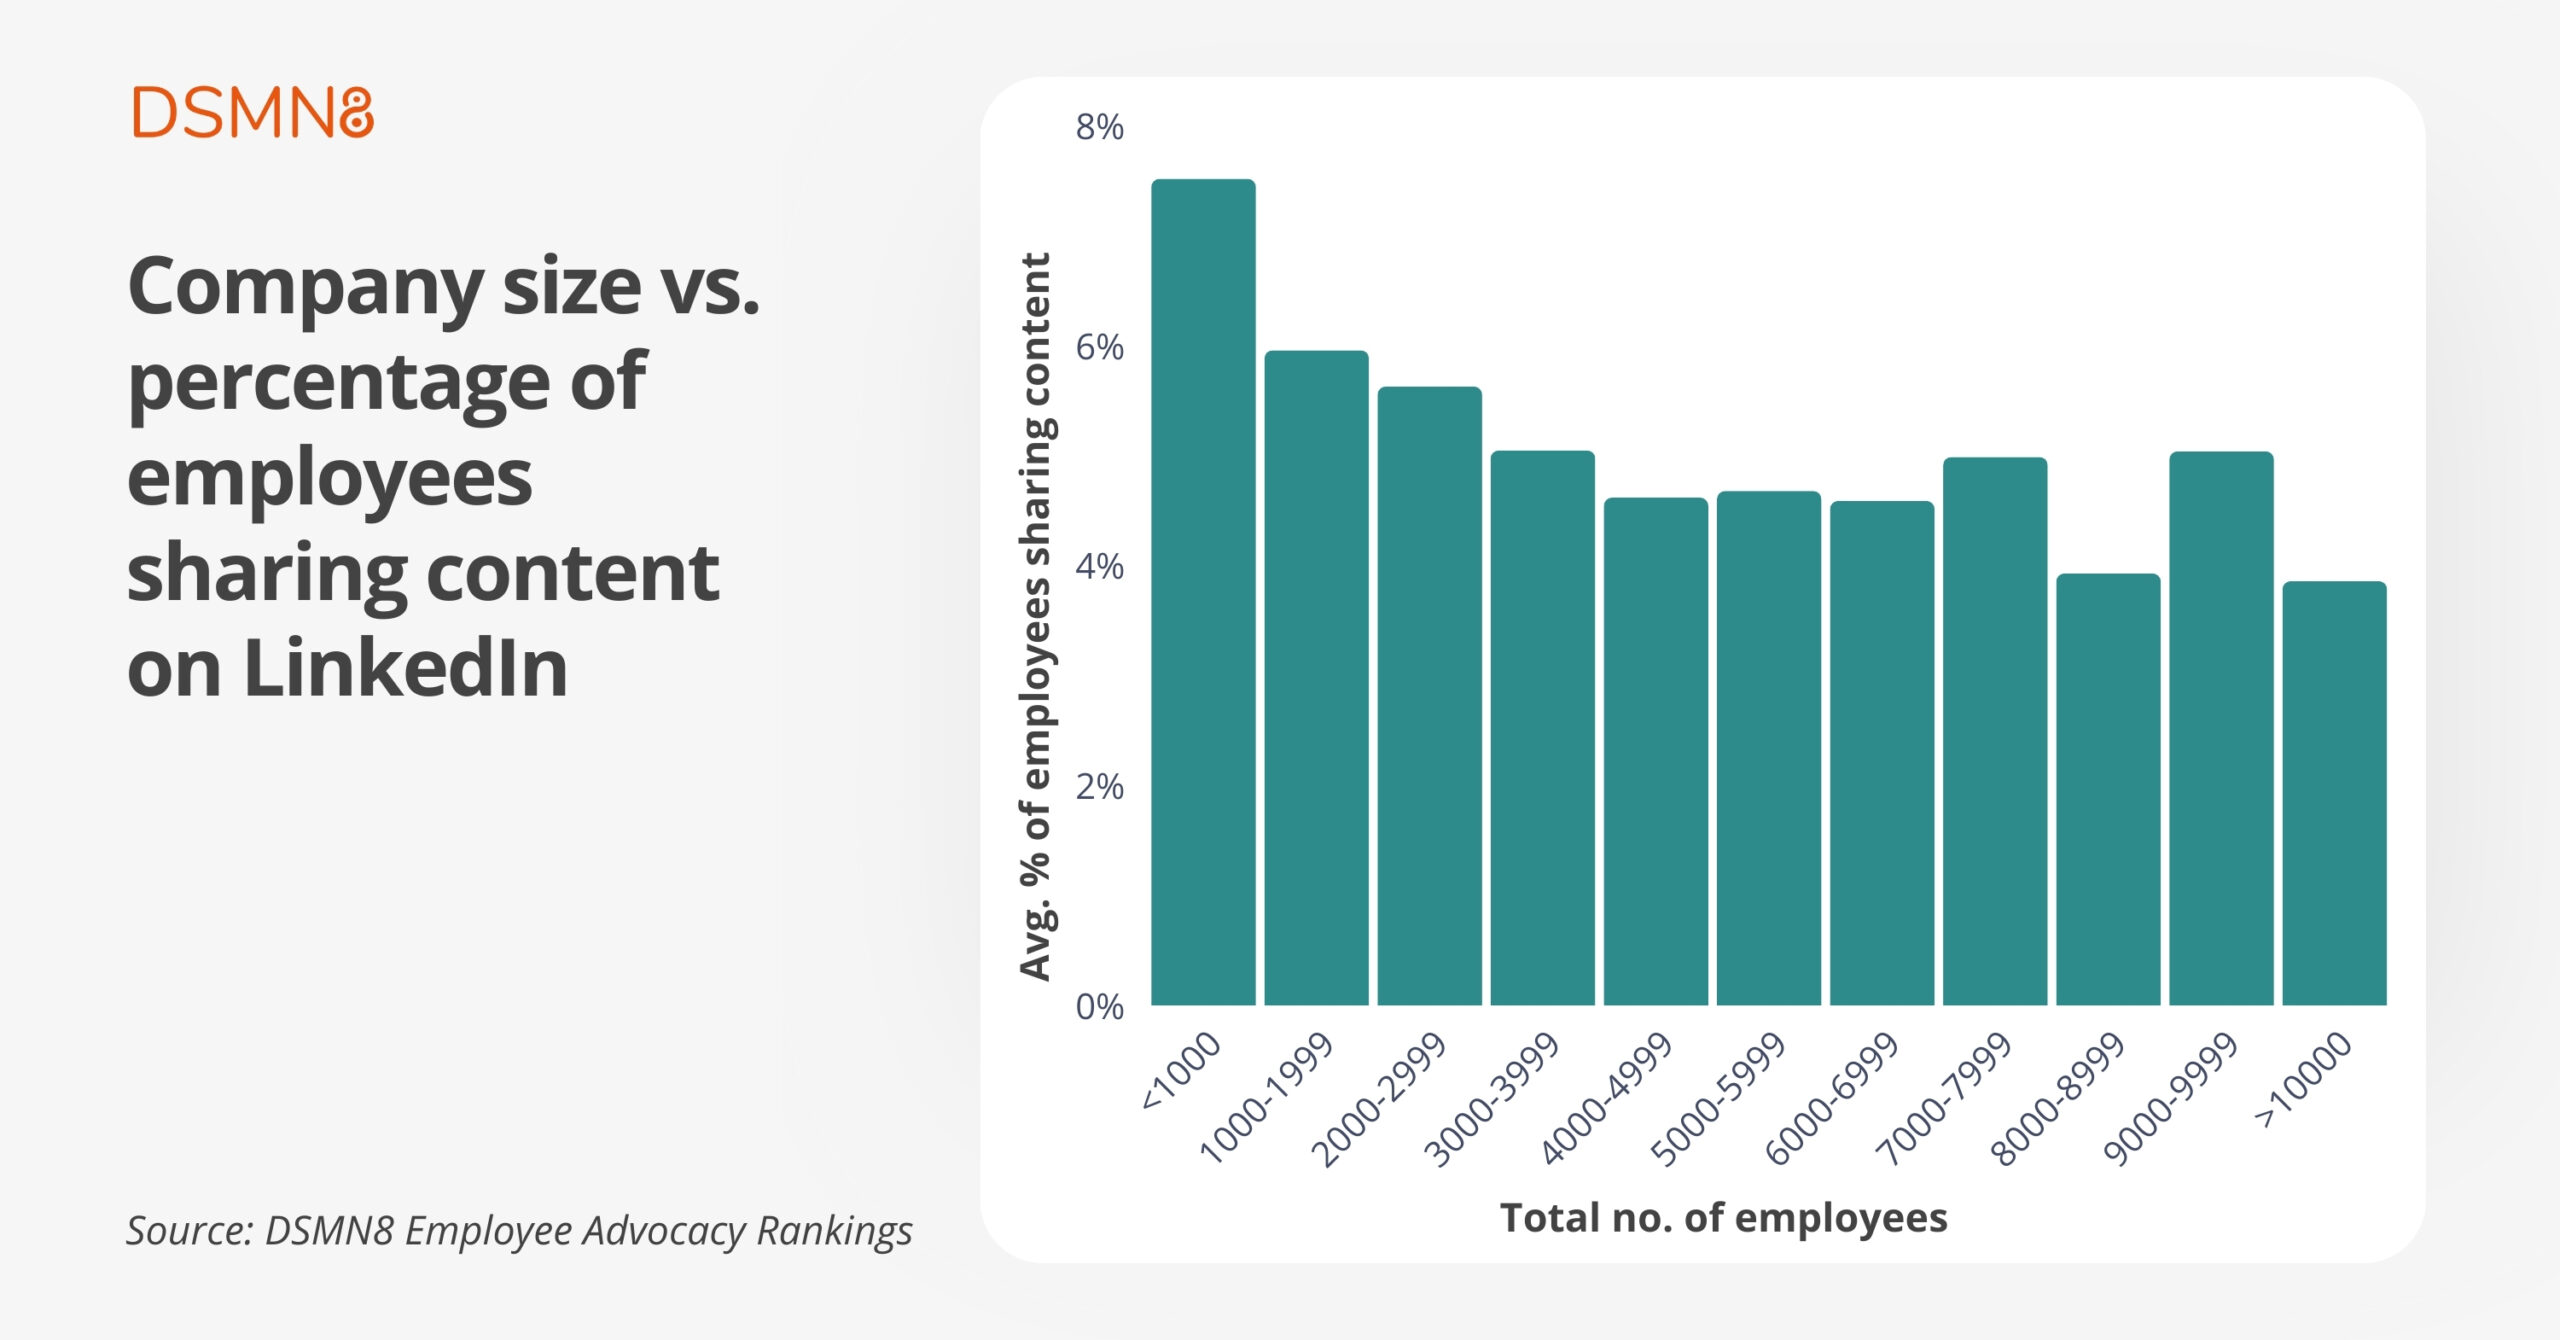
Company size vs. % of employees sharing content on LinkedIn.
The data here supports a hunch I had:
Employees in smaller organizations are more likely to become employee advocates than those in large ones.
The average percentage of employees sharing content in companies with less than 1,000 employees was 7.52%, ranking highest overall.
The average across all company sizes was 6.54%.
In contrast, organizations with over 10,000 employees had an average content-sharing rate of just 3.86%.
Why is this?
Those at smaller organizations may be more likely to feel that building brand awareness is everyone’s responsibility, particularly when the marketing team is small.
It’s reasonable to assume that SMB employees interact more with leadership and consequently may feel a greater personal connection to the company and its mission 🤝
Smaller companies are also likely to prioritize cost efficiency, and an employee advocacy program requires much less investment than other marketing strategies, such as social media advertising and influencer campaigns.
On the other hand, those who work at household-name brands may be concerned about ‘stepping on toes’, leaving content creation to the marketing team and/or agencies. Or perhaps they simply feel that their efforts won’t have much of an impact compared with large-scale, high-budget media campaigns 😫
However, as you can see from the chart, this isn’t completely linear. There’s a spike in the 9,000-9,999 mark, with a higher percentage of content sharing in these organizations than the 4,000-8,999 employee categories.
One possible reason for this could be that companies with 9,000-9,999 employees may be in a growth stage. This would make them more focused on social media for sharing new role openings, employer branding content to attract talent, or investment/financial news. Once reaching the 10,000-employee mark, priorities may shift away from recruitment.
| Company Size | % of Employees Sharing Content |
|---|---|
| <1,000 | 7.52% |
| 1,000-1,999 | 5.96% |
| 2,000-2,999 | 5.63% |
| 3,000-3,999 | 5.05% |
| 4,000-4,999 | 4.62% |
| 5,000-5,999 | 4.68% |
| 6,000-6,999 | 4.59% |
| 7,000-7,999 | 4.99% |
| 8,000-8,999 | 3.93% |
| 9,000-9,999 | 5.04% |
| >10,000 | 3.86% |
| Total | 6.54% |
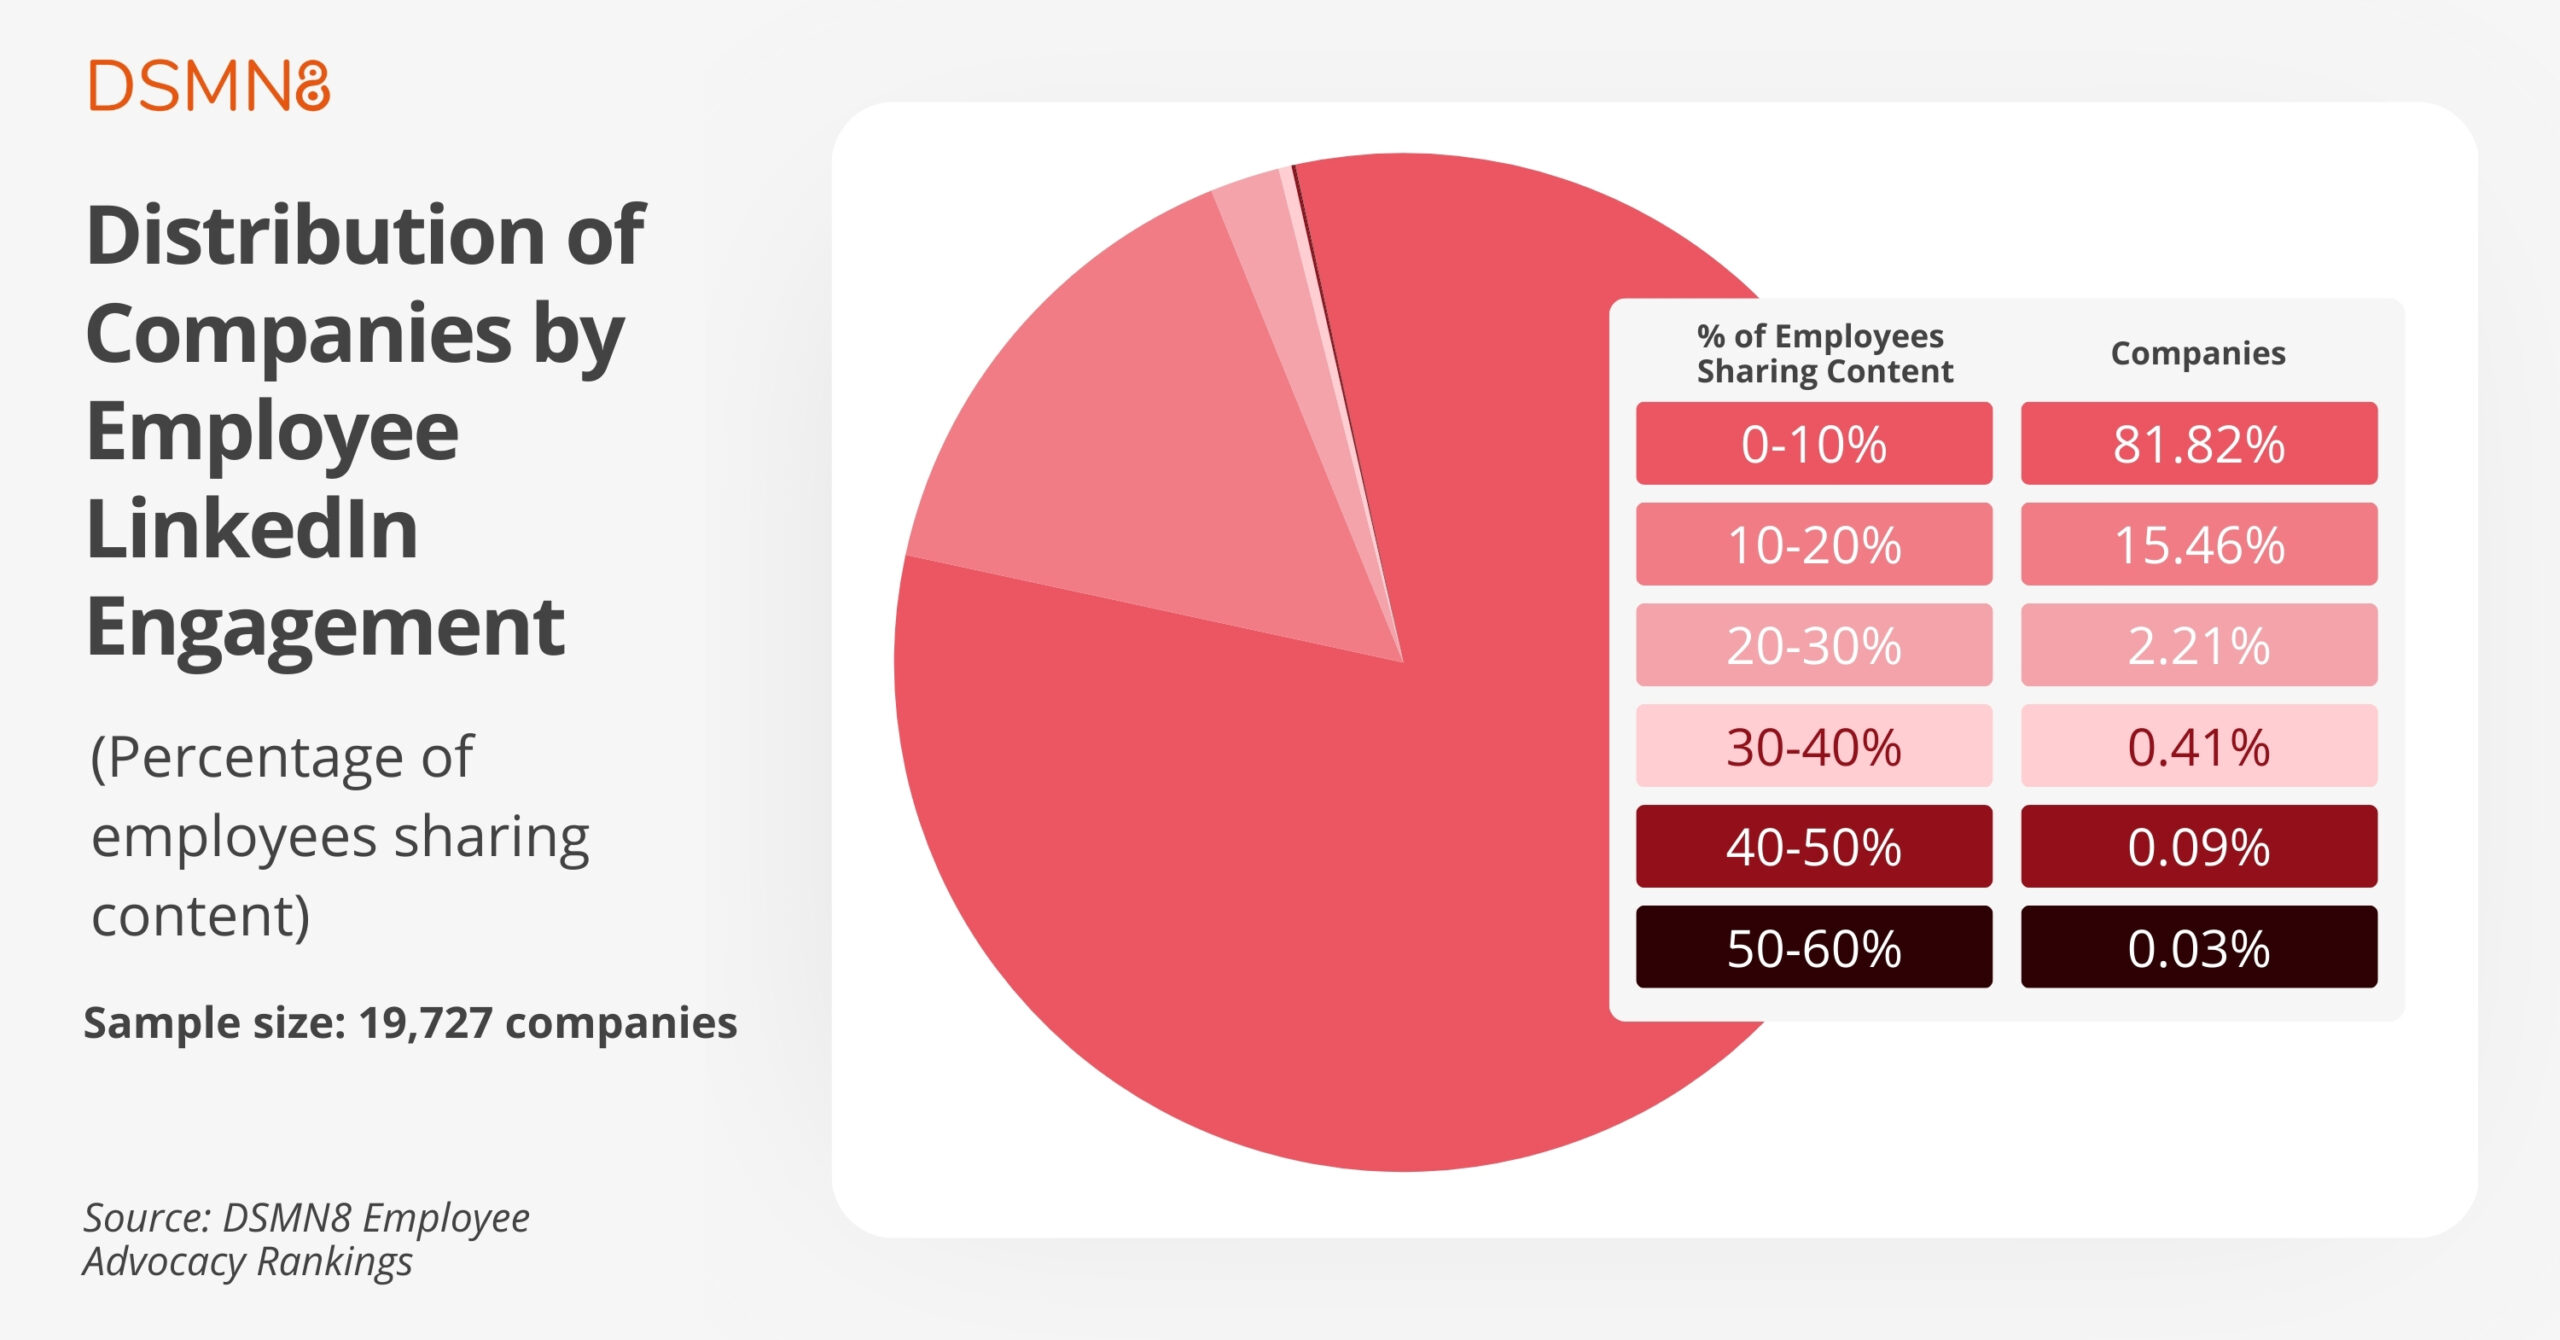
Distribution of companies by employee LinkedIn engagement
Looking at our overall sample size of 19,727 companies, it’s evident that the vast majority of organizations (81.82%) only see up to 10% of employees sharing content on LinkedIn.
Comparing this to the industry percentages I shared at the beginning of this article, it’s clear that the following industries are going above and beyond:
- Unicorn Startups: 18.01%
- Training & Coaching: 16.81%
- Computer Networks & Cyber Security: 15.97%
- PR & Communications: 11.83%
As expected, the number of companies declines as the percentage of employees sharing content increases. But the difference between 0-10% and 10-20% is pretty stark!
Only 6 of the nearly 20,000 organizations had 50-60% of employees sharing content on LinkedIn.
Additional Resources
For more data on employee LinkedIn activity in 90+ industries, check out the Global Employee Advocacy Rankings.
Our data team puts these together on a regular basis, revealing which organizations are leading the way with employee social media presence 🏆
To understand your organization’s impact in more detail, request a free Employee Advocacy Health Check.
This personalized report will reveal your overall employee presence on LinkedIn and your social share of voice across different teams and seniority. Plus, gain insights on up to 4 competitors in your sector!
Emily Neal
SEO and Content Specialist at DSMN8. Emily has 10 years experience blogging, and is a pro at Pinterest Marketing, reaching 1 million monthly views. She’s all about empowering employees to grow their personal brands and become influencers.

